Chapter 6 Discriminant Correspondence Analysis
6.1 Description
As the name indicates, discriminant correspondence analysis(DCA) is an extension of discriminant analysis (DA) and correspondence analysis (CA). Like discriminant analysis, the goal of DCA is to categorize observations in pre-defined groups, and like correspondence analysis,it is used with nominal variables. The main idea behind DCA is to represent each group by the sum of its observations and to perform a simple CA on the groups by variables matrix. The original observations are then projected as supplementary elements and each observation is assigned to the closest group. The comparison between the a priori and the a posteriori classifications can be used to assess the quality of the discrimination. A similar procedure can be used to assign new observations to categories. The stability of the analysis can be evaluated using cross-validation techniques such as jack knifing or bootstrapping.
6.2 Density plot
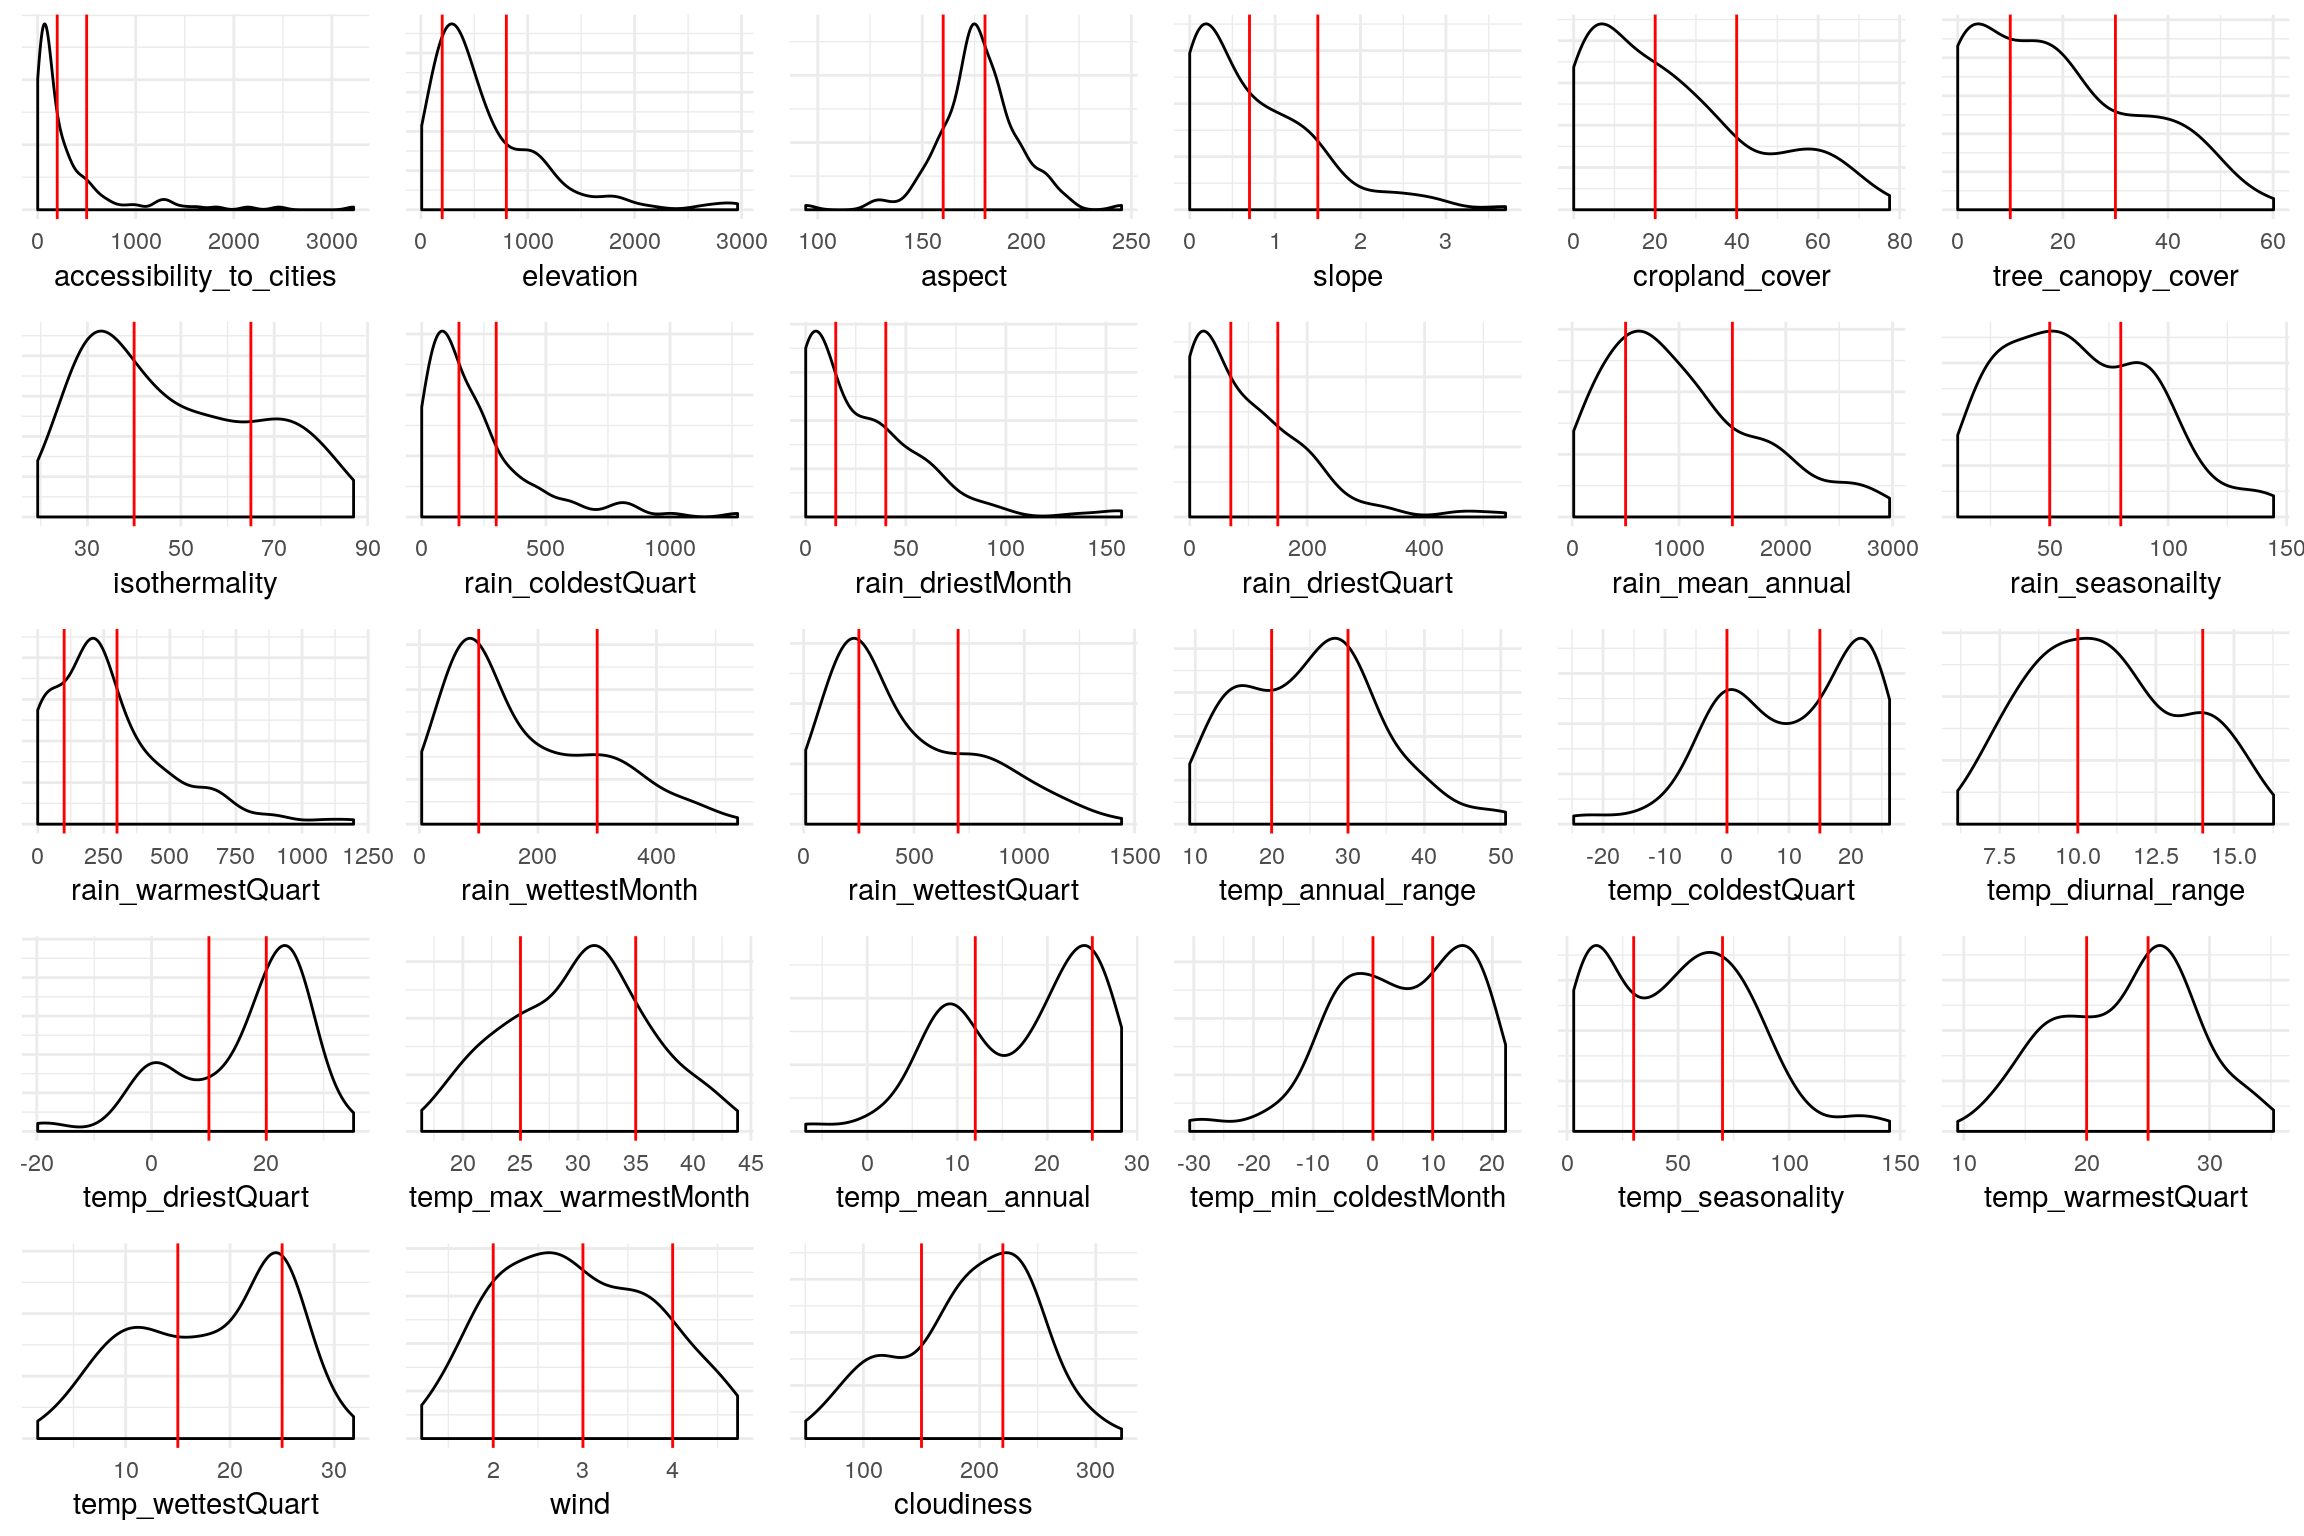
Let’s observe the distribution of each variables to get an intuition of how we can bin these variables. It’s important to have nearly equal number of observations in the each bin and to try to cut the variables in a way to so that each new binned distribution is nearly Gaussian. We can also verify that our binning is appropiate by calculating Spearman Correlation for each of original variable and binned variable, the correlation coefficient should be close to 1.
6.3 Binning
Structure of Data after binning based on above observation.
## 'data.frame':    137 obs. of  27 variables:
##  $ accessibility_to_cities: int  2 1 3 2 2 1 3 1 1 1 ...
##  $ elevation              : int  3 2 2 3 2 3 2 3 2 1 ...
##  $ aspect                 : int  3 3 3 2 1 3 3 2 1 2 ...
##  $ slope                  : int  3 3 1 1 1 3 1 2 2 1 ...
##  $ cropland_cover         : int  1 2 1 1 2 2 1 2 2 3 ...
##  $ tree_canopy_cover      : int  1 2 1 2 1 1 1 3 1 2 ...
##  $ isothermality          : int  1 1 2 2 2 1 2 1 1 2 ...
##  $ rain_coldestQuart      : int  1 3 1 1 1 1 1 2 1 1 ...
##  $ rain_driestMonth       : int  1 3 1 1 2 2 1 3 2 1 ...
##  $ rain_driestQuart       : int  1 2 1 1 1 1 1 3 1 1 ...
##  $ rain_mean_annual       : int  1 2 1 2 2 2 1 2 1 3 ...
##  $ rain_seasonailty       : int  3 1 2 3 1 1 2 1 1 3 ...
##  $ rain_warmestQuart      : int  1 2 1 3 2 2 2 3 1 3 ...
##  $ rain_wettestMonth      : int  1 2 1 2 1 1 1 2 1 3 ...
##  $ rain_wettestQuart      : int  1 2 1 2 1 1 1 2 1 3 ...
##  $ temp_annual_range      : int  3 2 3 2 2 3 2 2 3 2 ...
##  $ temp_coldestQuart      : int  1 2 2 3 2 1 2 1 2 3 ...
##  $ temp_diurnal_range     : int  3 1 3 2 2 2 2 1 1 1 ...
##  $ temp_driestQuart       : int  3 2 3 2 2 1 2 1 2 2 ...
##  $ temp_max_warmestMonth  : int  2 2 3 2 2 1 3 1 2 2 ...
##  $ temp_mean_annual       : int  1 1 2 2 2 1 2 1 1 3 ...
##  $ temp_min_coldestMonth  : int  1 1 2 2 2 1 2 1 1 3 ...
##  $ temp_seasonality       : int  3 2 3 1 2 3 2 2 3 2 ...
##  $ temp_warmestQuart      : int  2 1 3 2 2 1 3 1 2 3 ...
##  $ temp_wettestQuart      : int  1 1 2 2 2 1 2 1 1 3 ...
##  $ wind                   : int  3 2 4 2 4 1 4 2 2 2 ...
##  $ cloudiness             : int  1 2 1 2 2 2 1 3 2 2 ...
6.4 Spearman Correlation
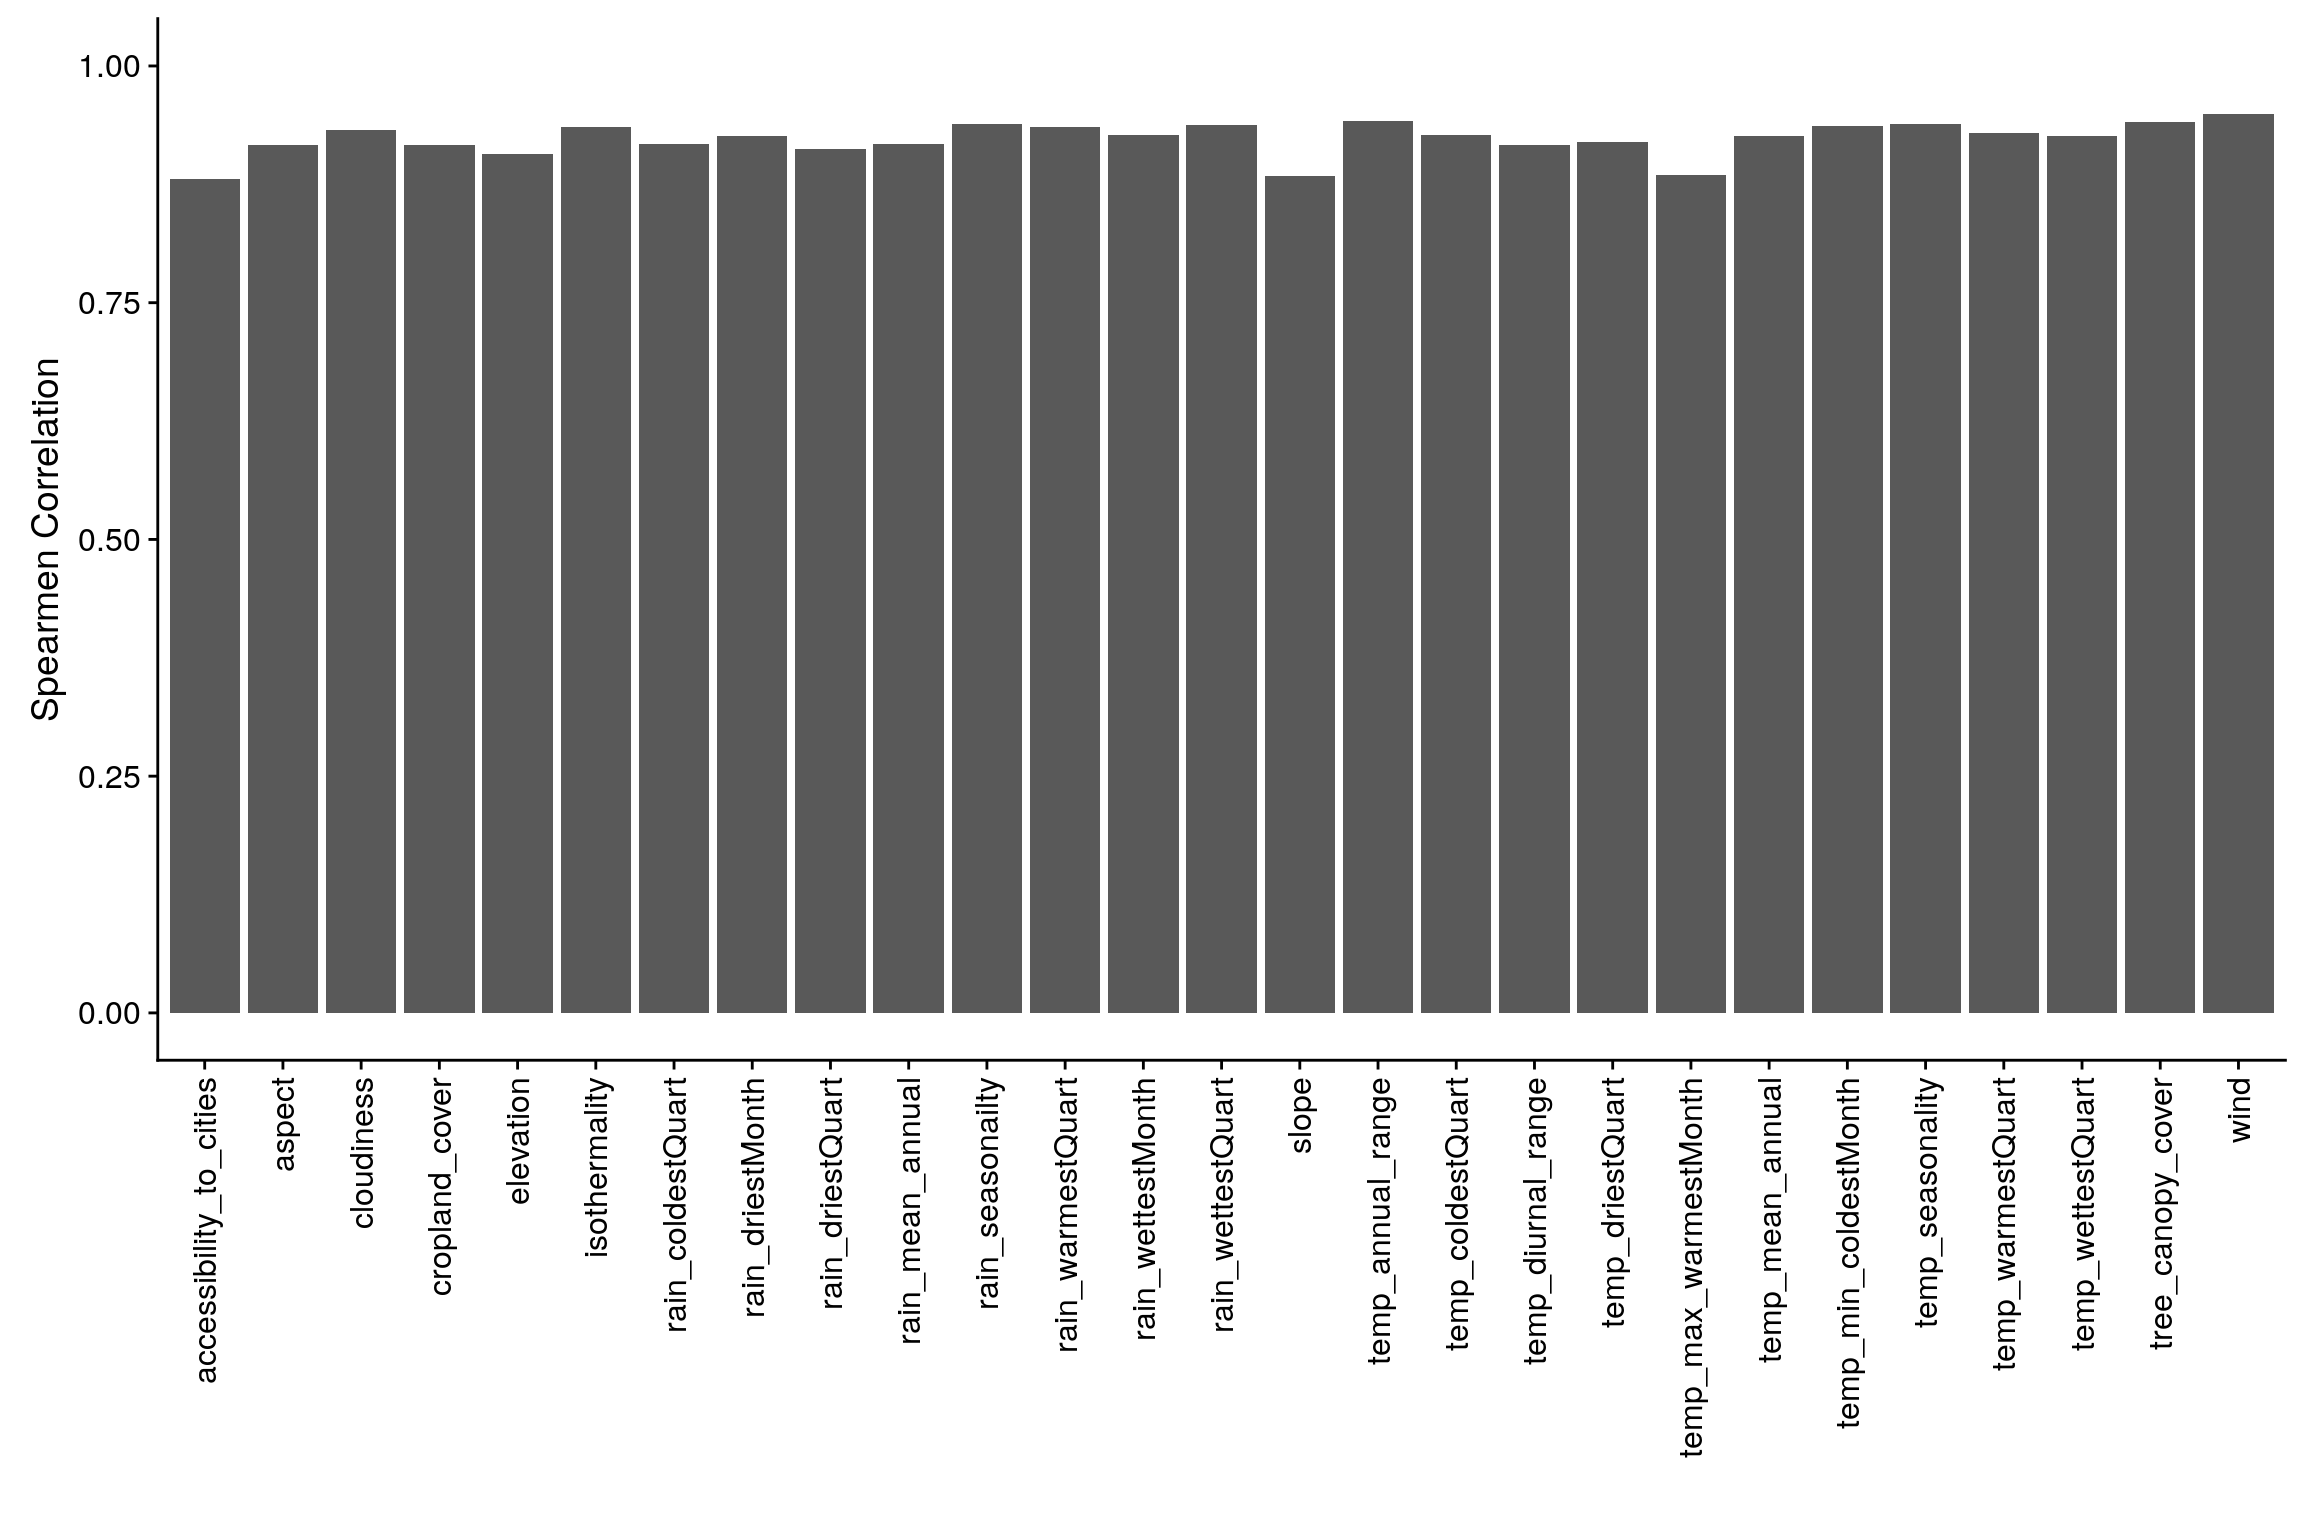
Let’s observe correlation between original data and binned data to make sure that neither the correlation ceofficient is too low or perfect.
6.5 Heatmap
- For binned data
Visually analyze multicollinearity in the system of the original data

6.6 Scree Plot
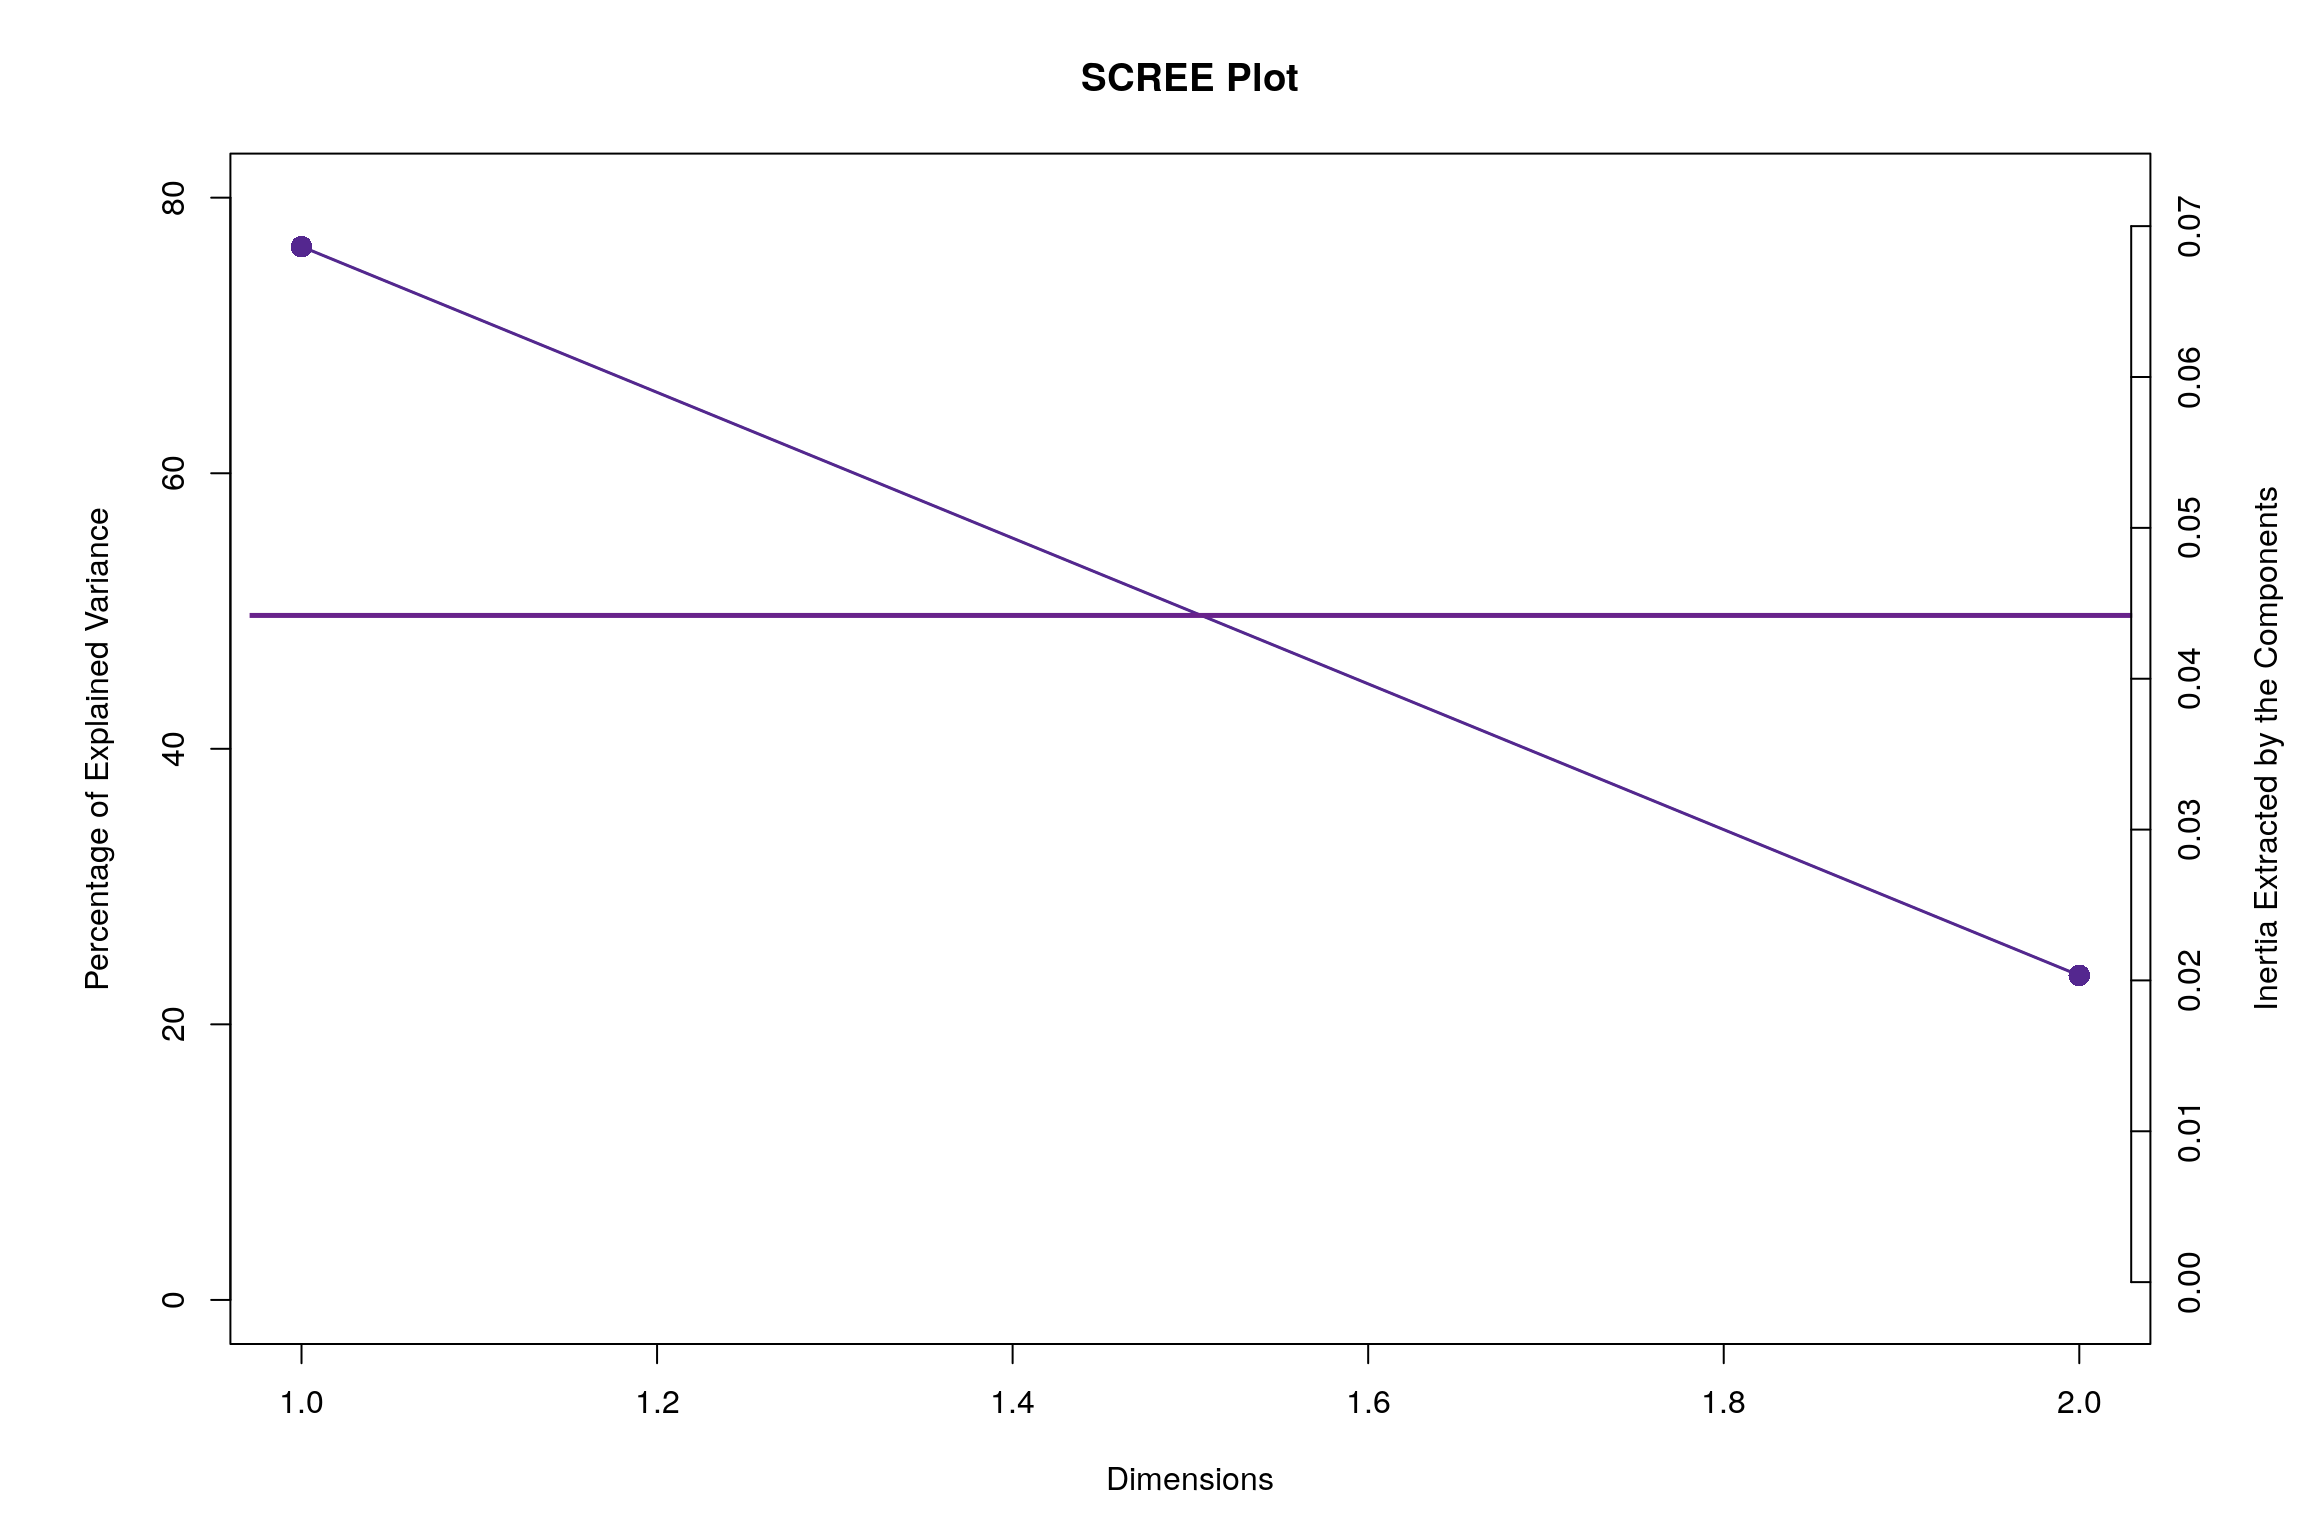
Gives amount of information explained by corresponding component. Gives an intuition to decide which components best represent data in order to answer the research question.
P.S. The most contribution component may not always be most useful for a given research question.
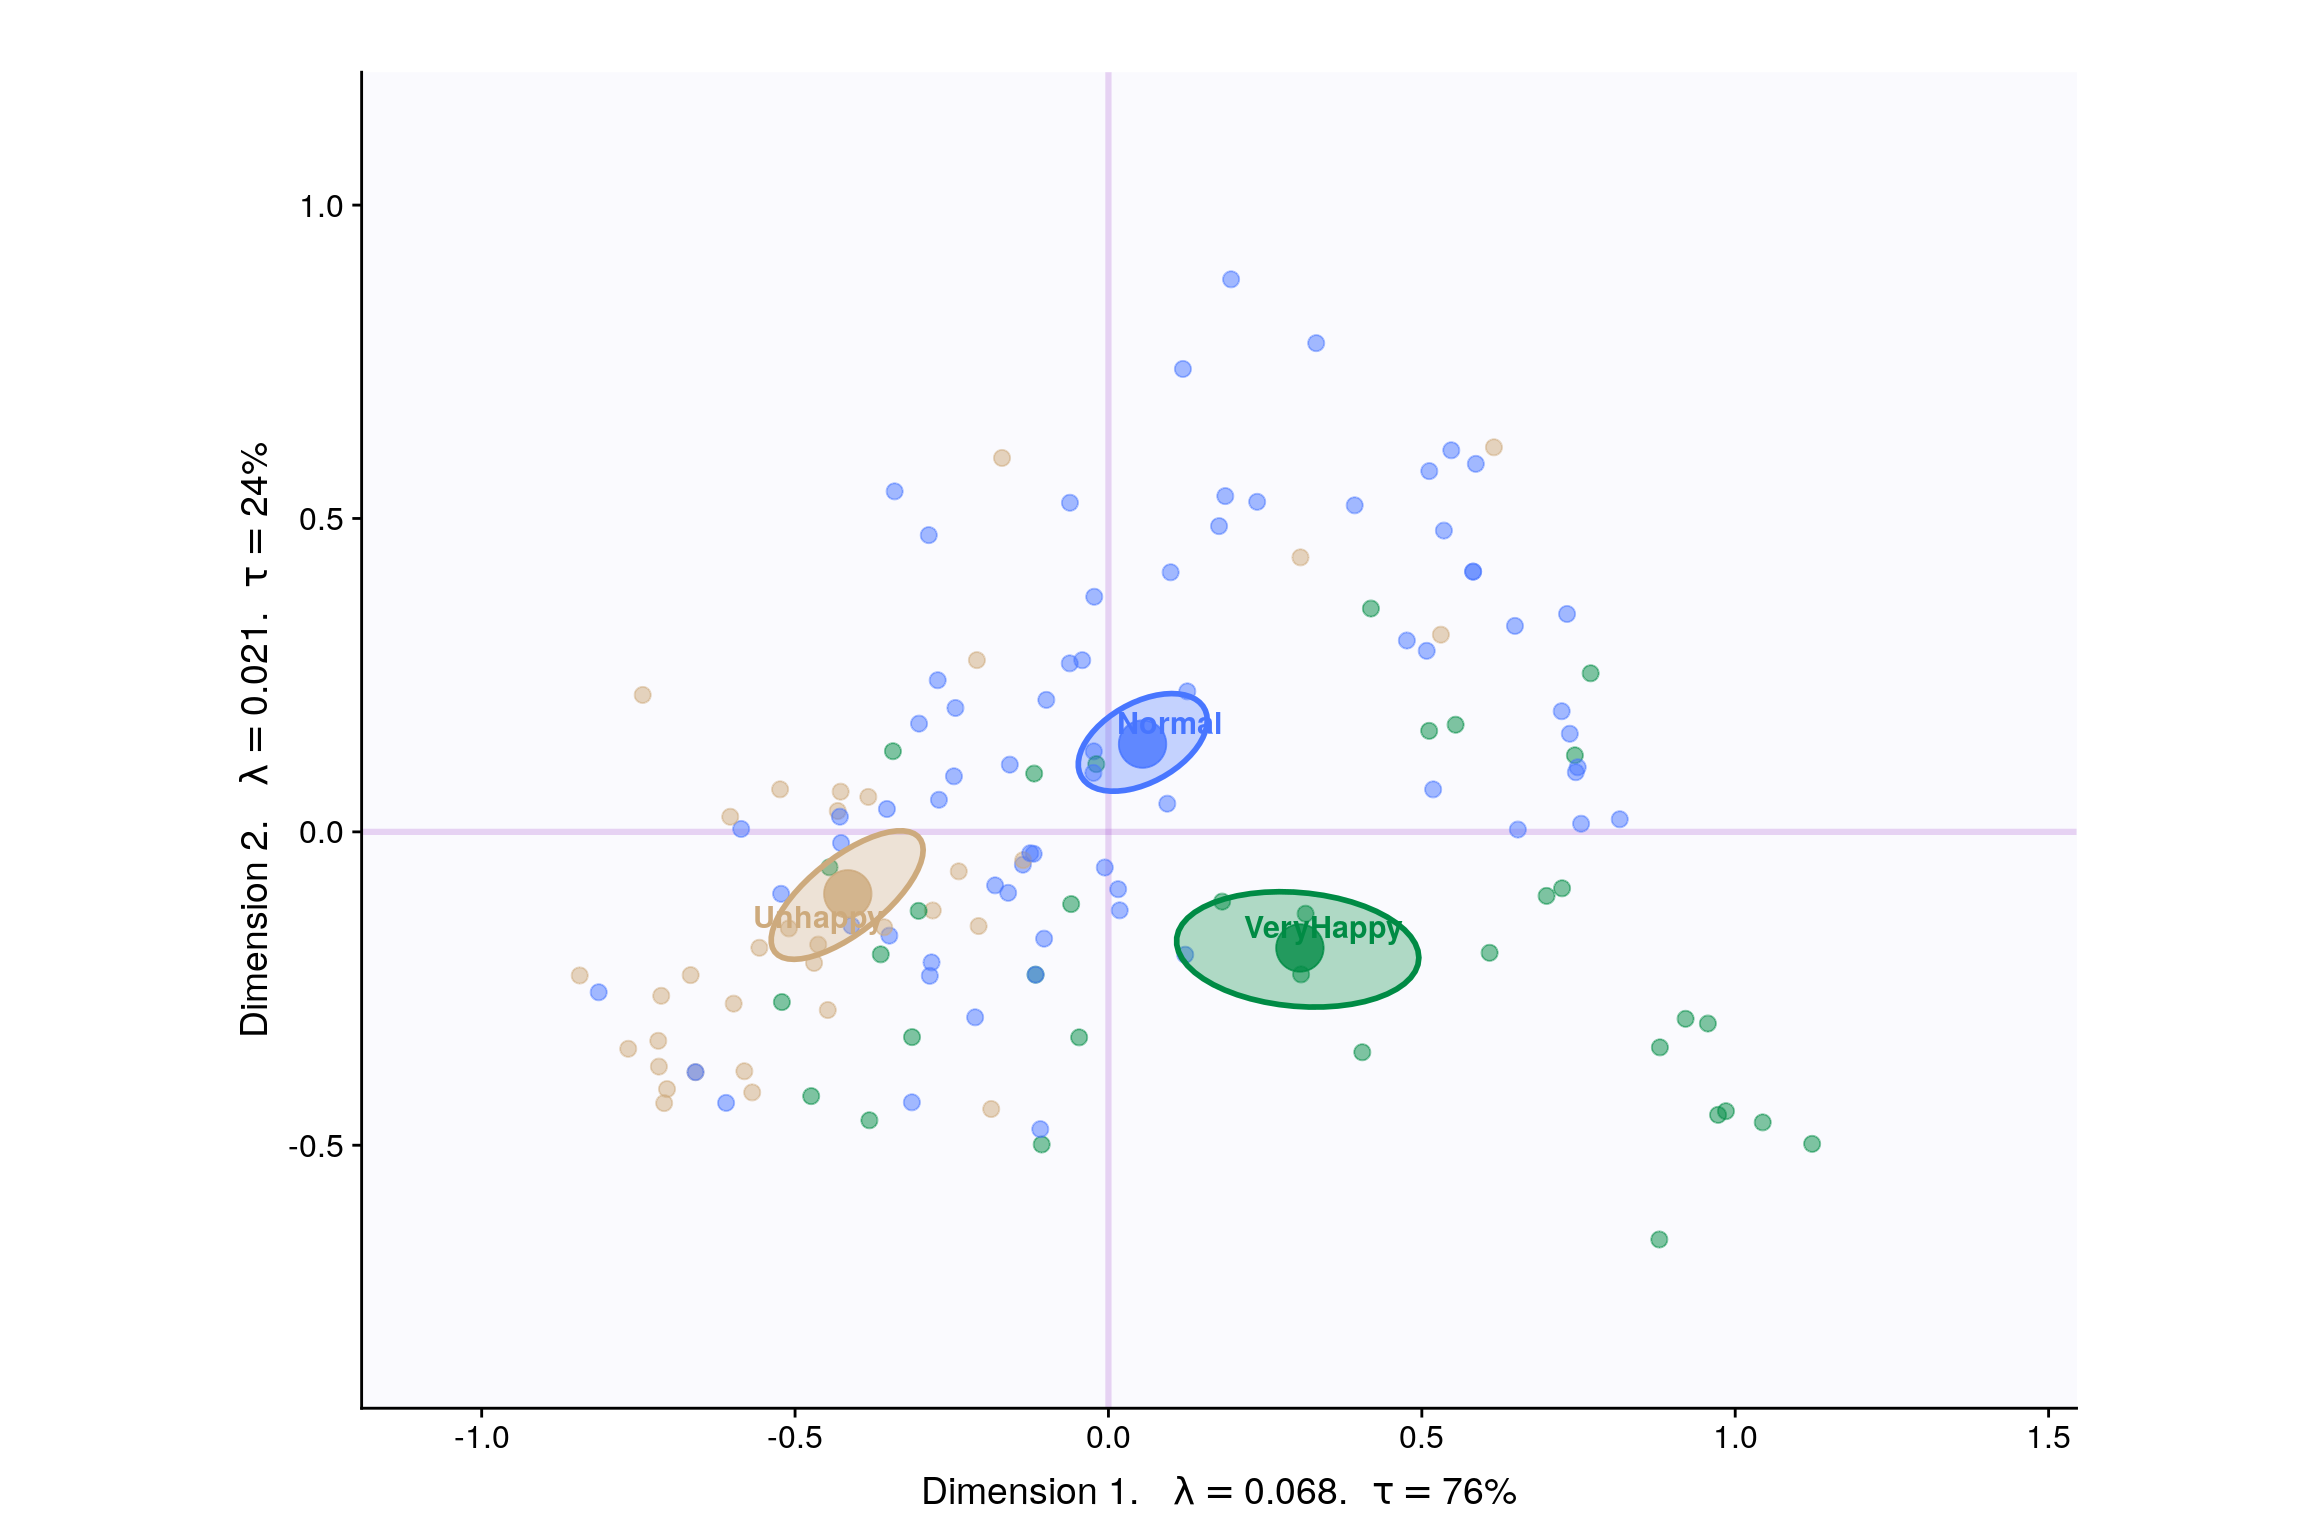
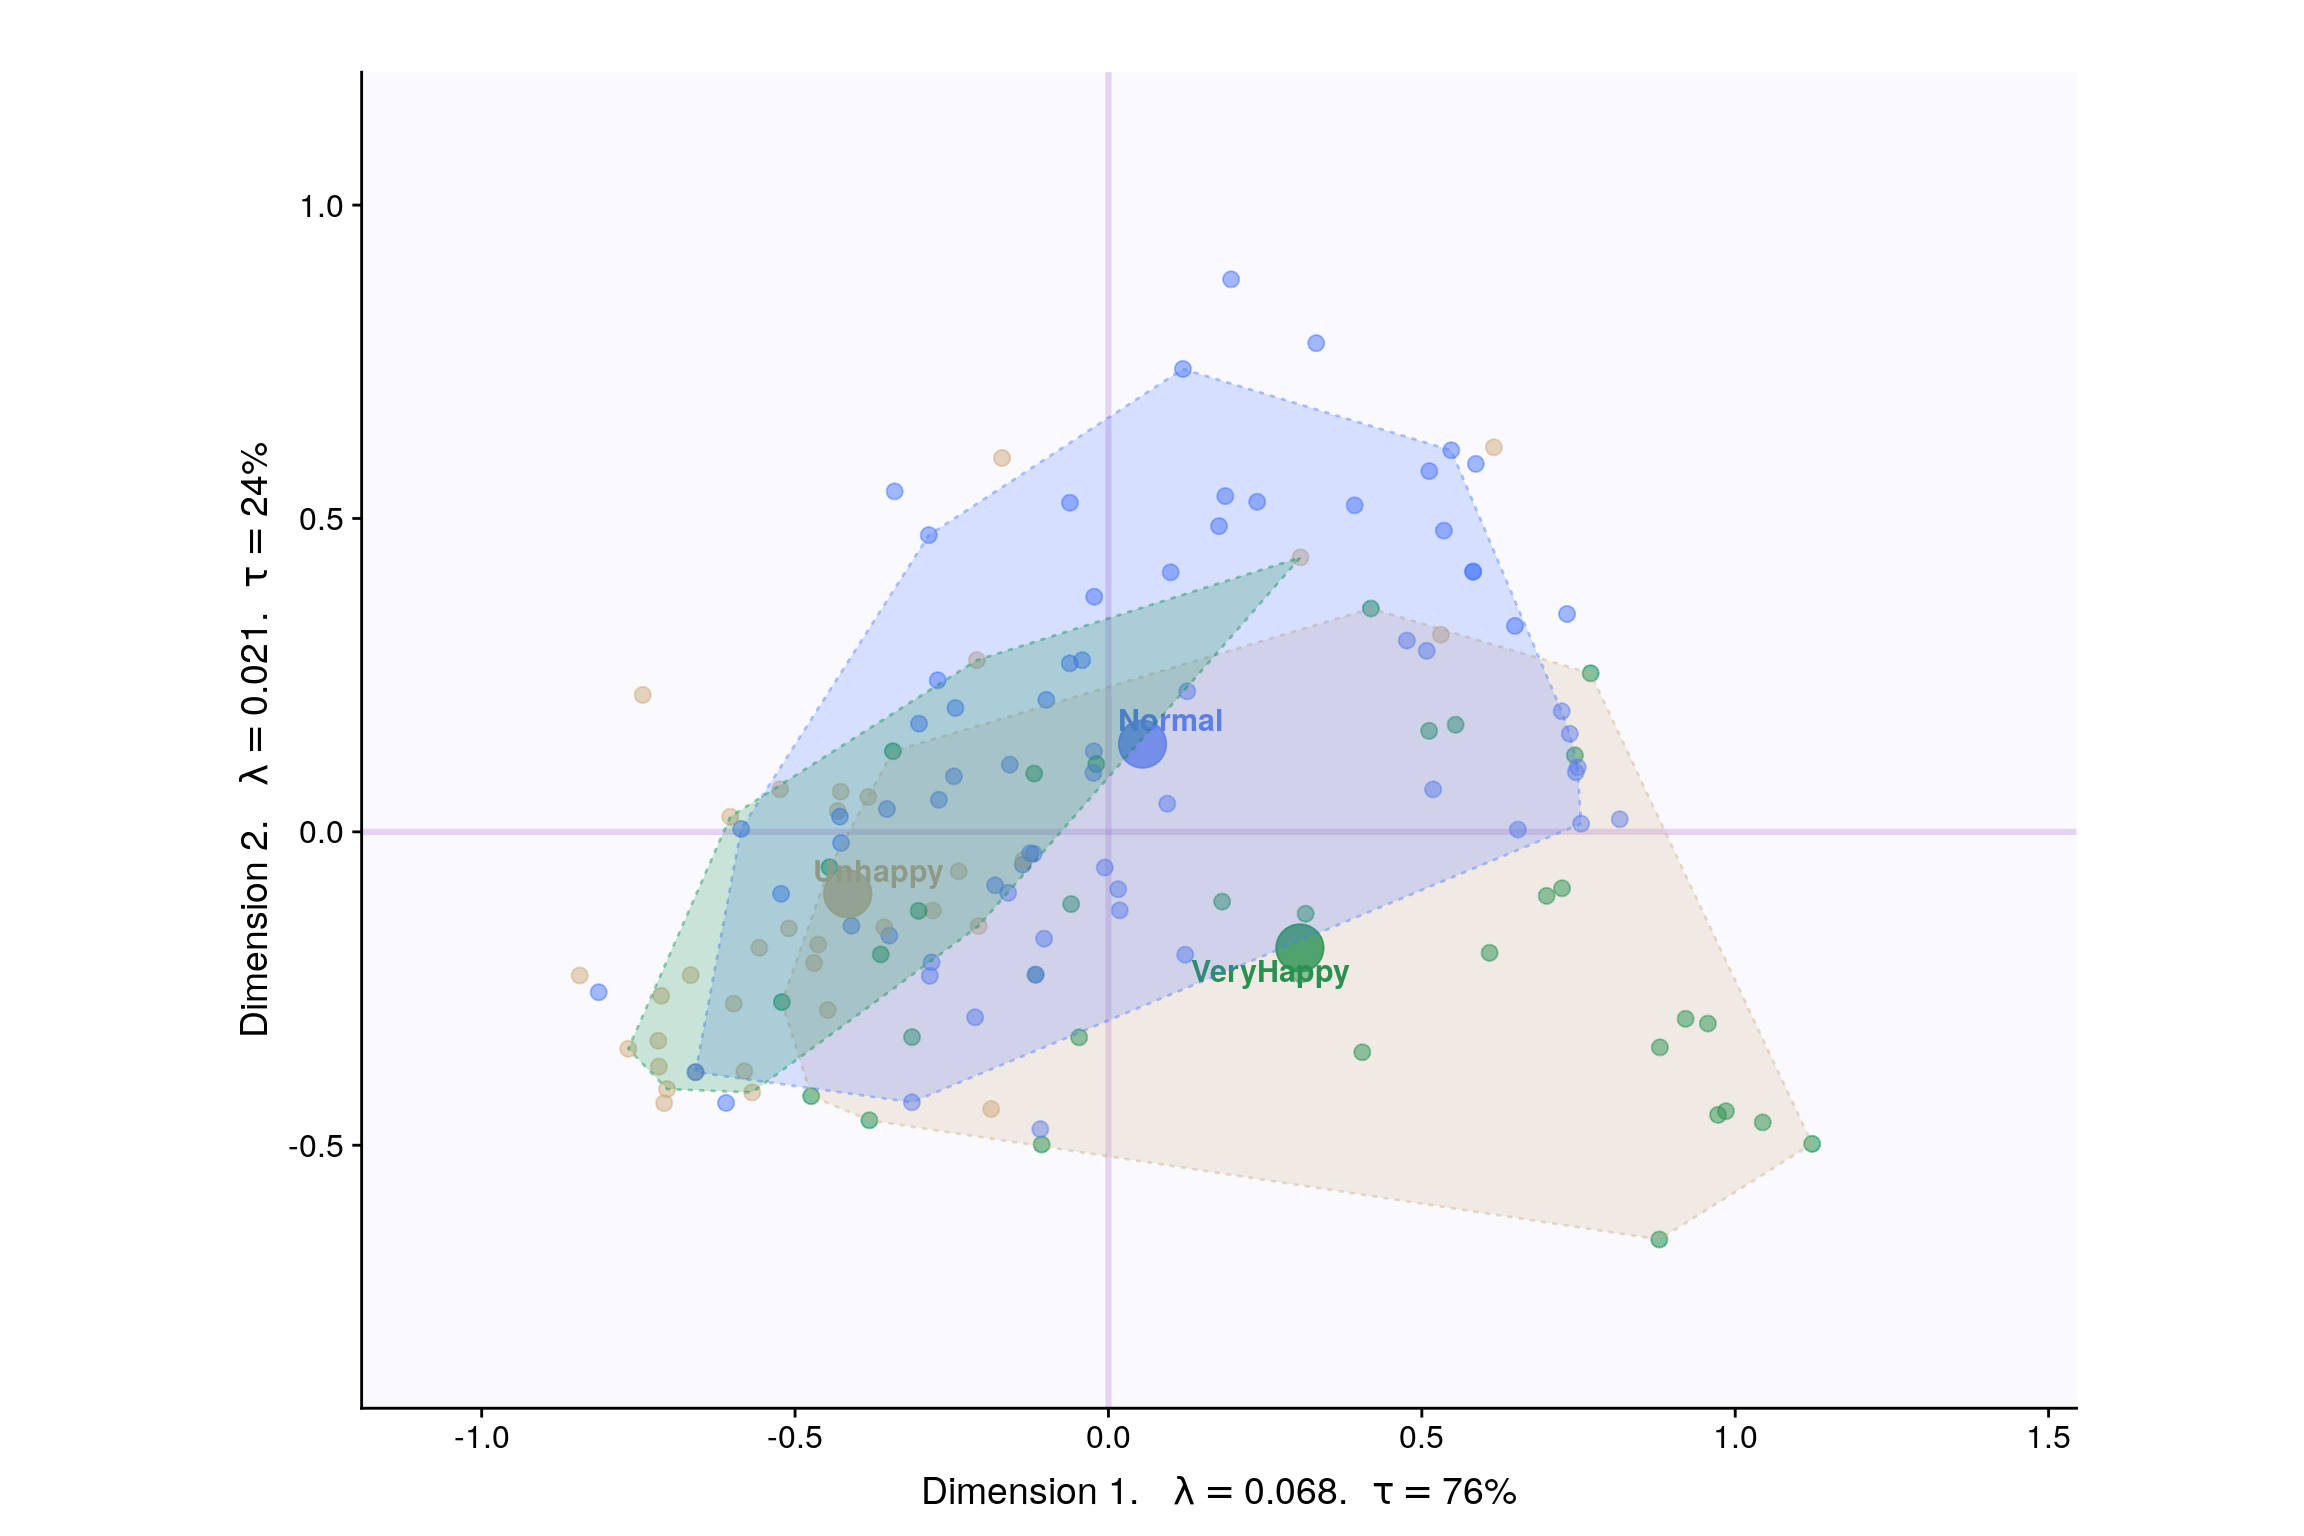
6.7 Factor Scores
With Confidence Interval
With Tolerance Interval
6.8 Loadings
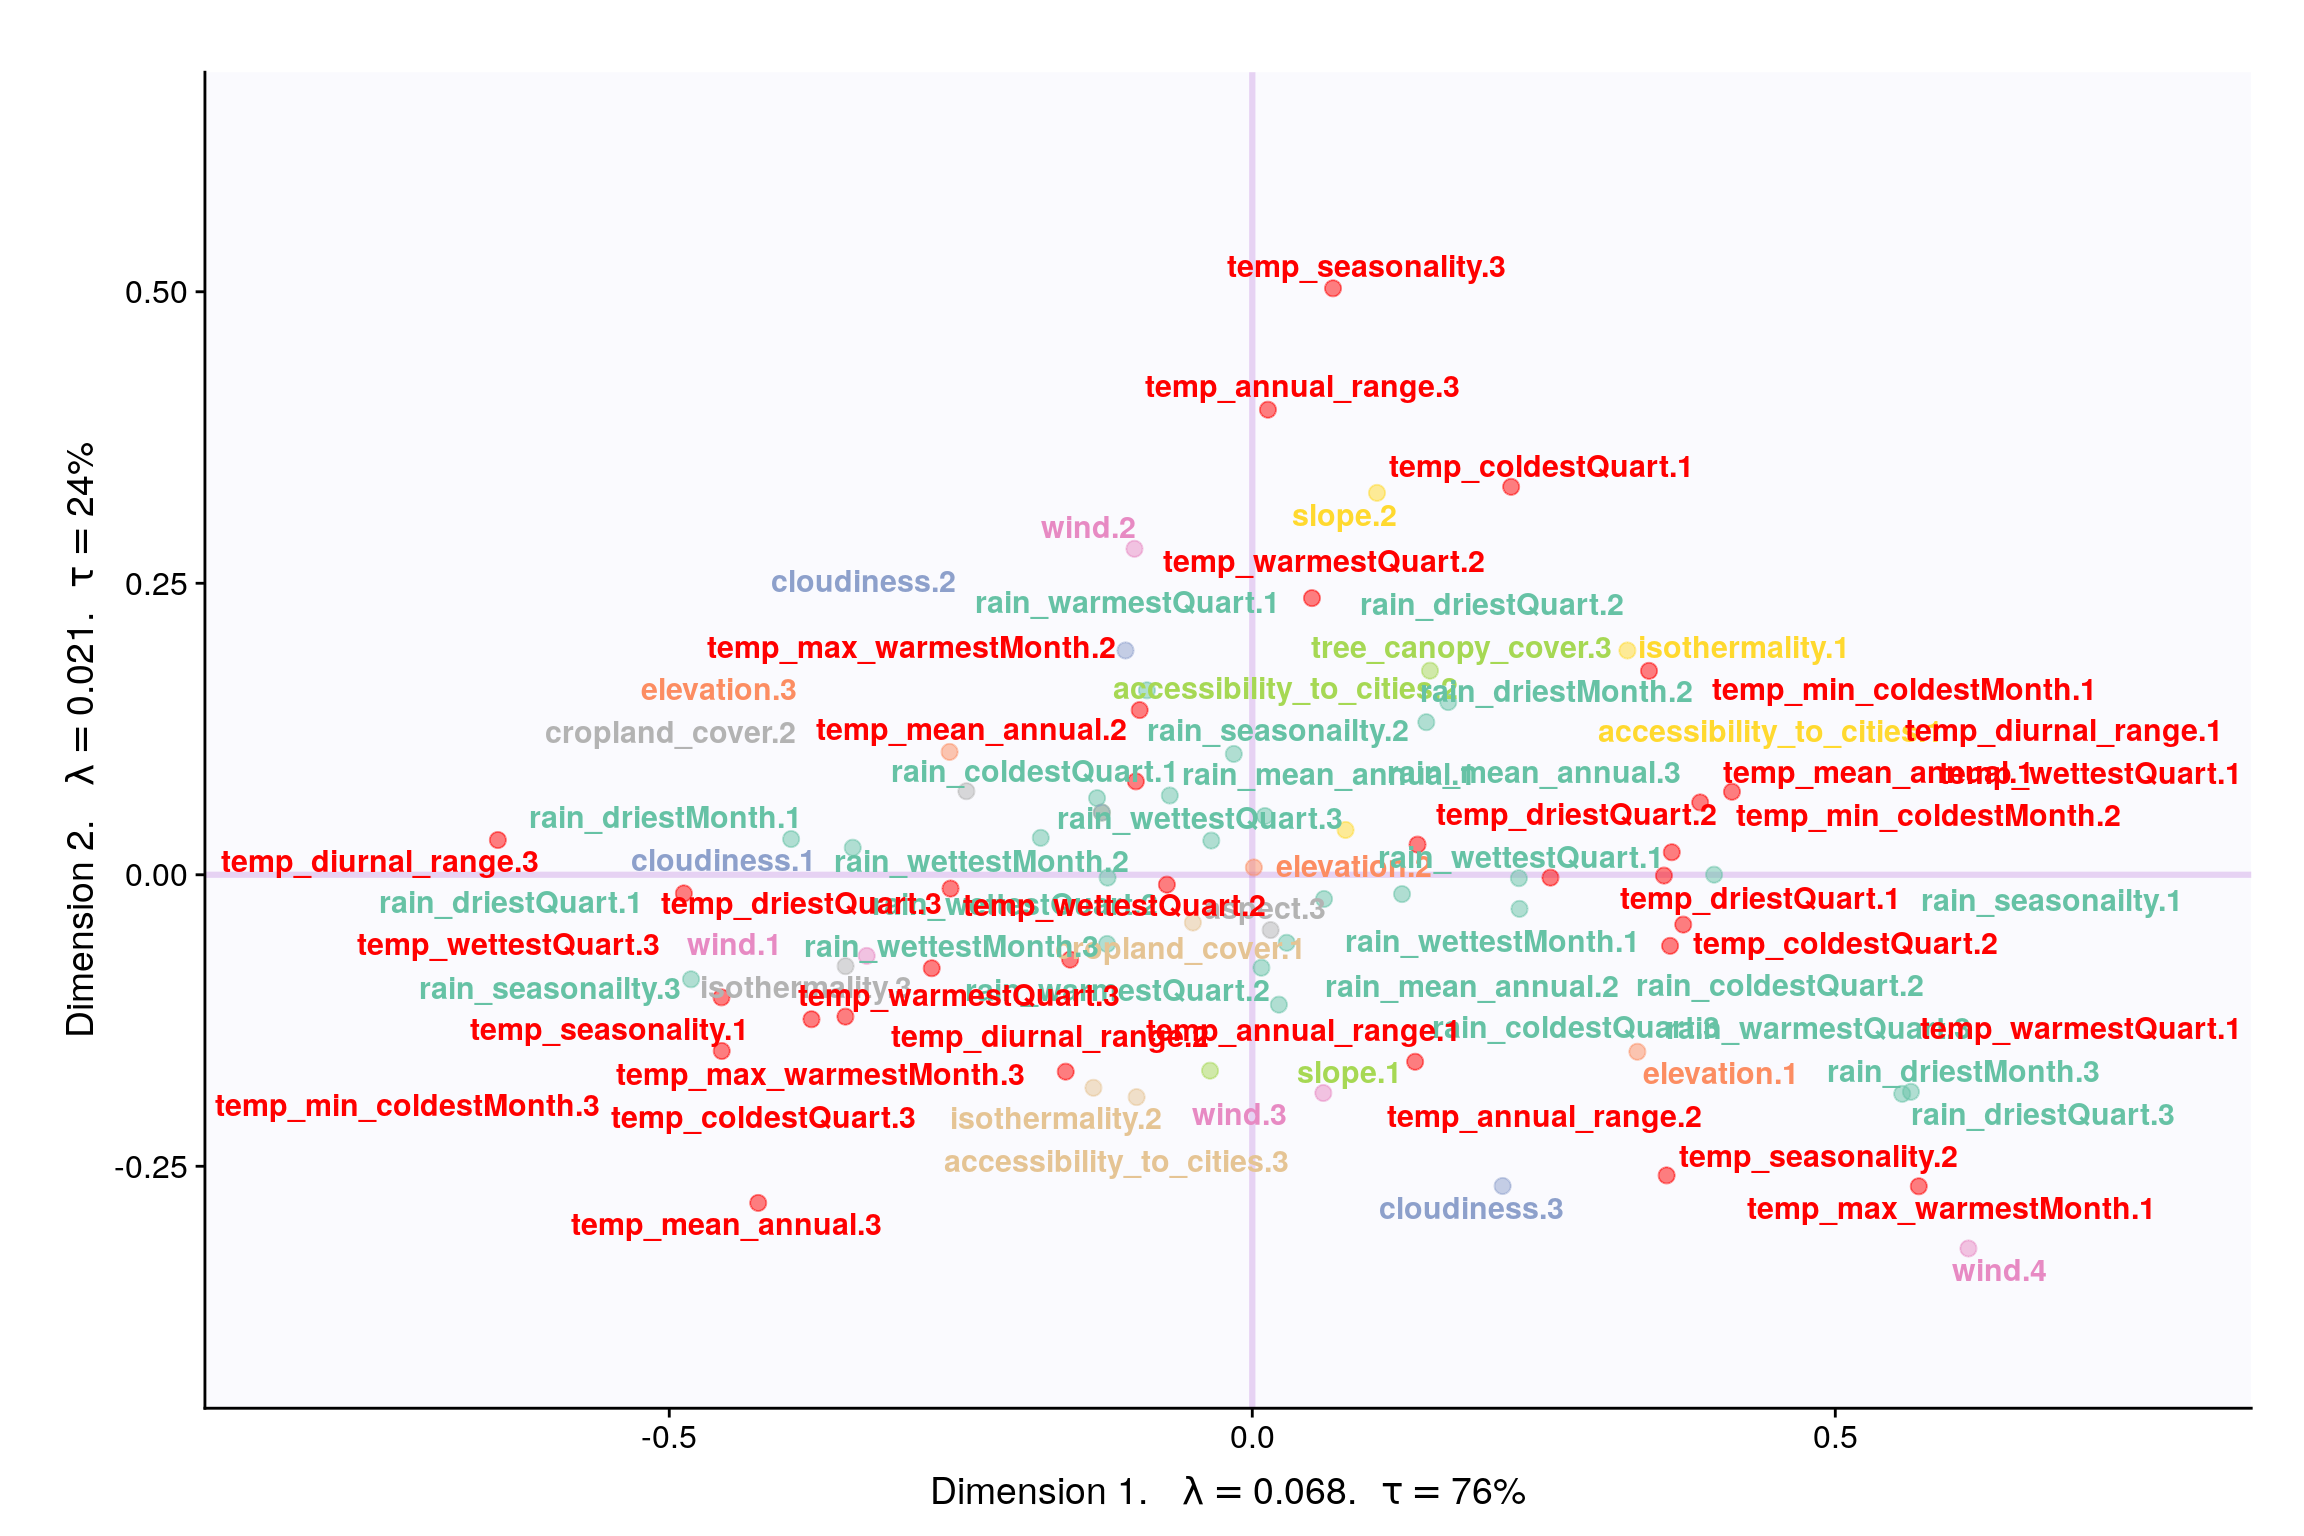
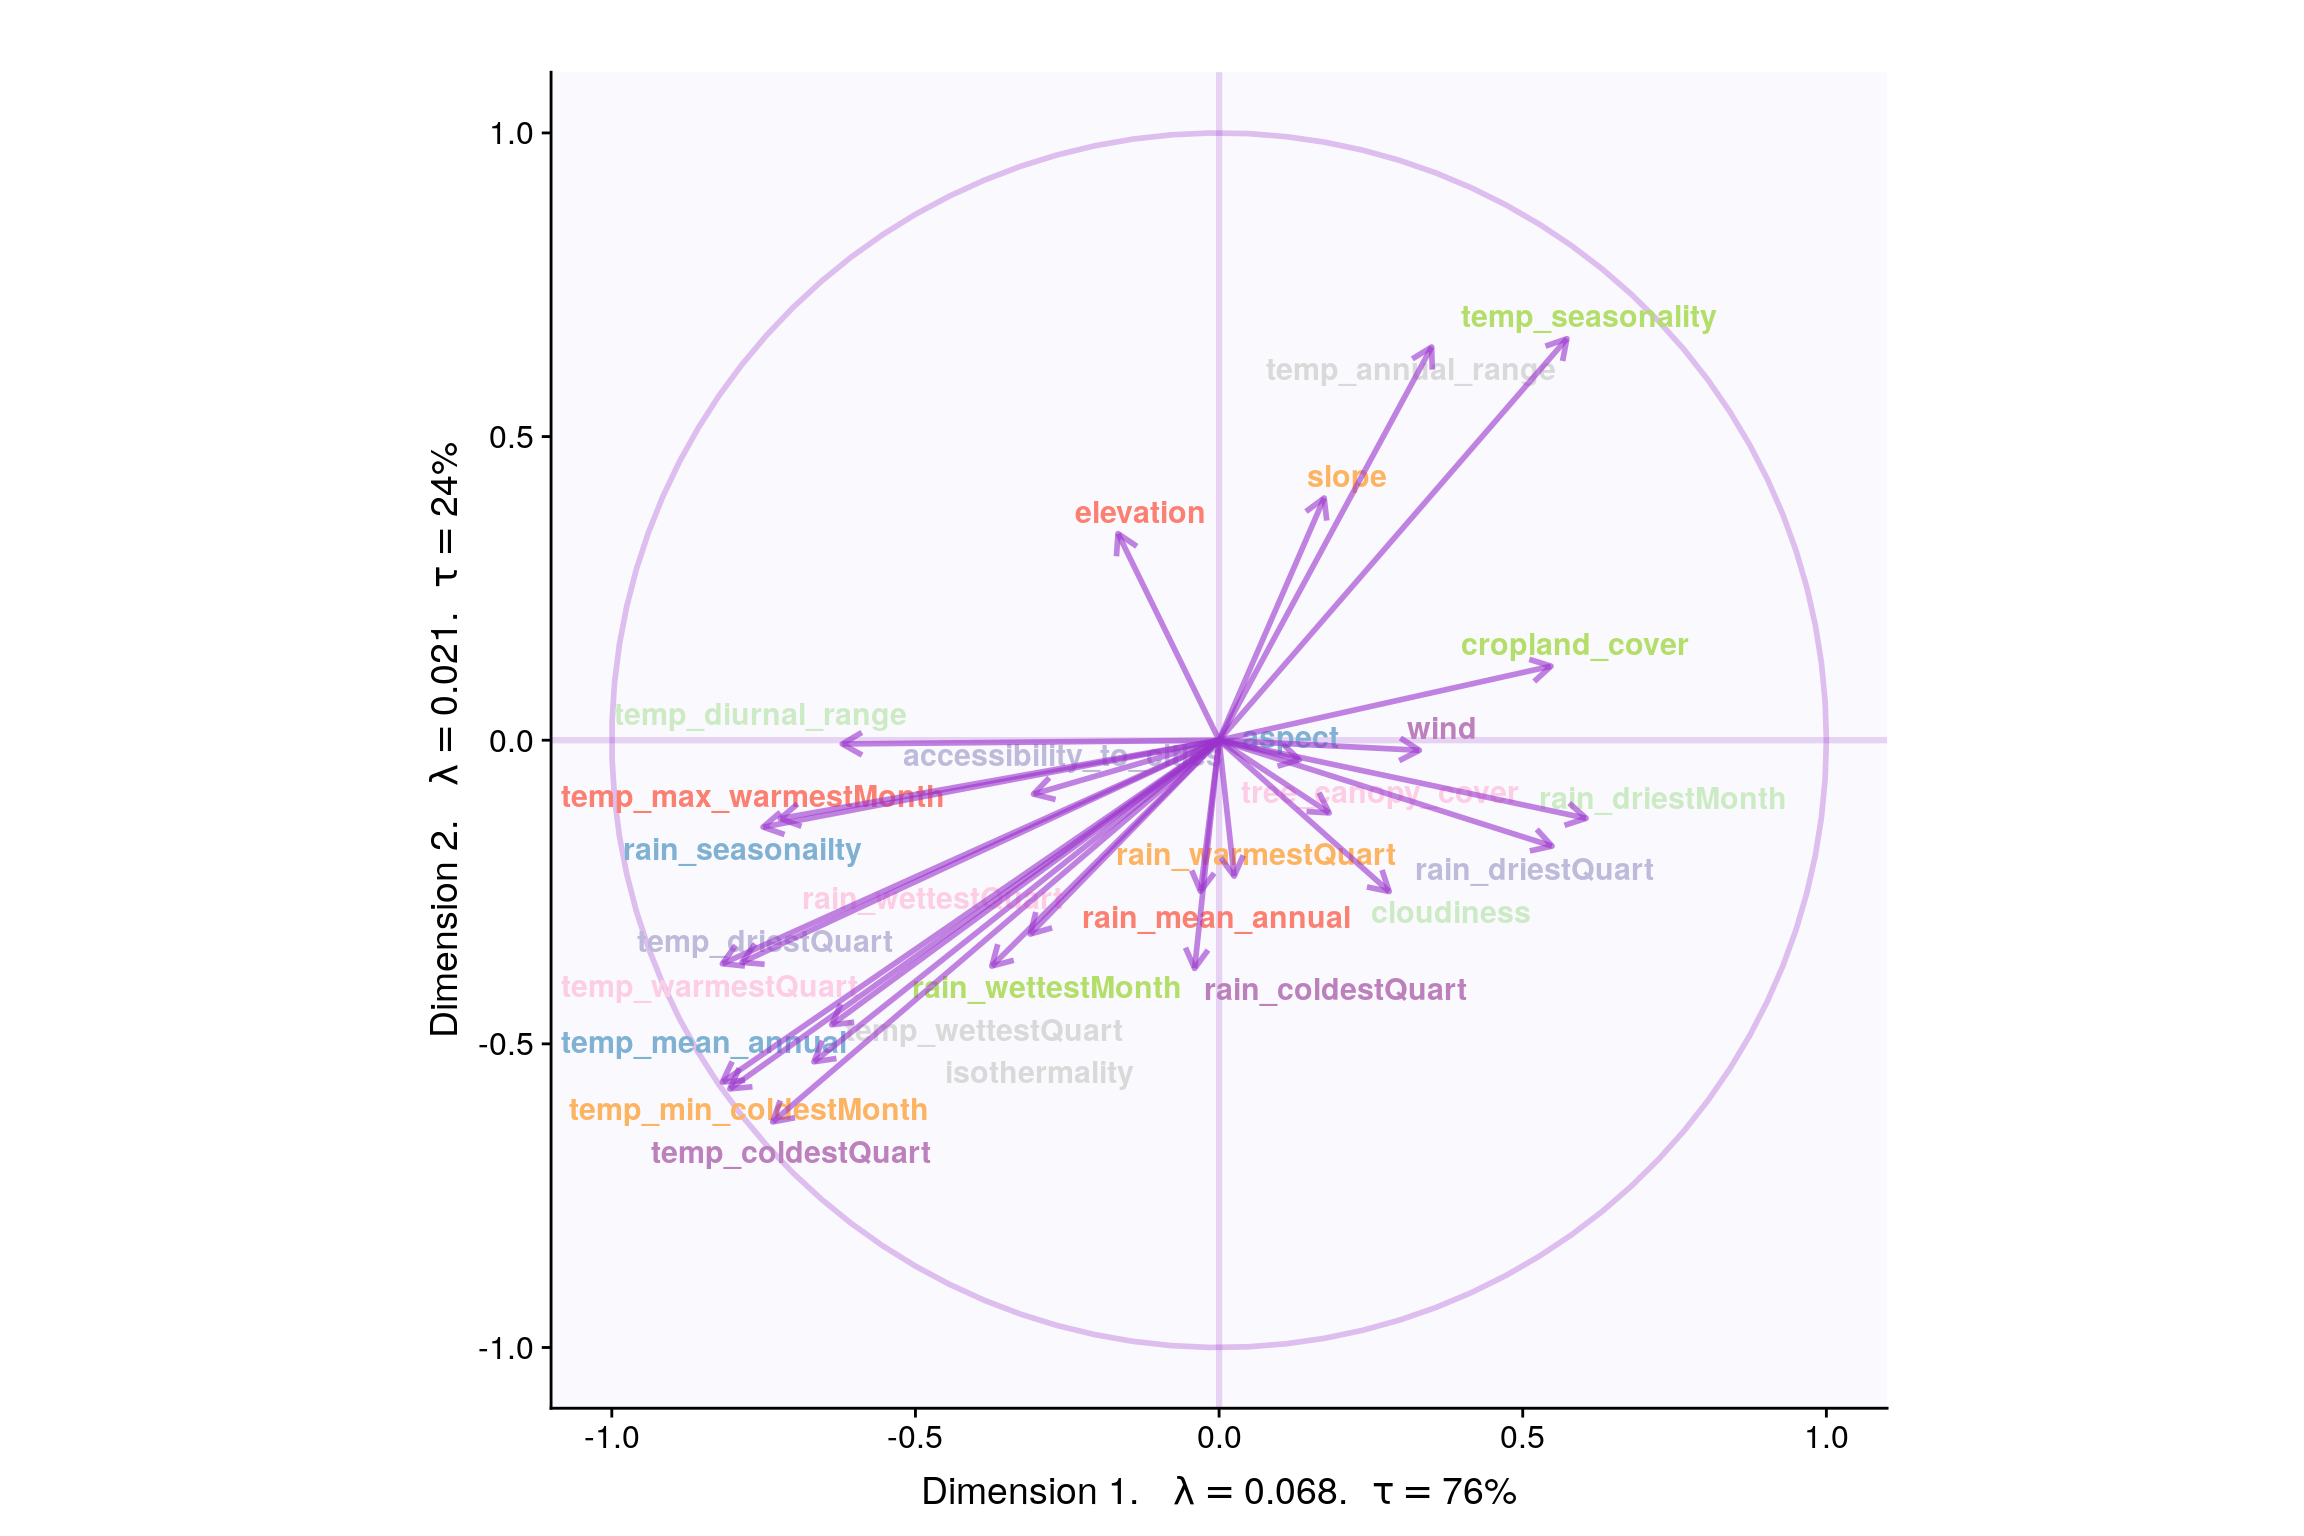
6.9 Loadings (correlation plot)
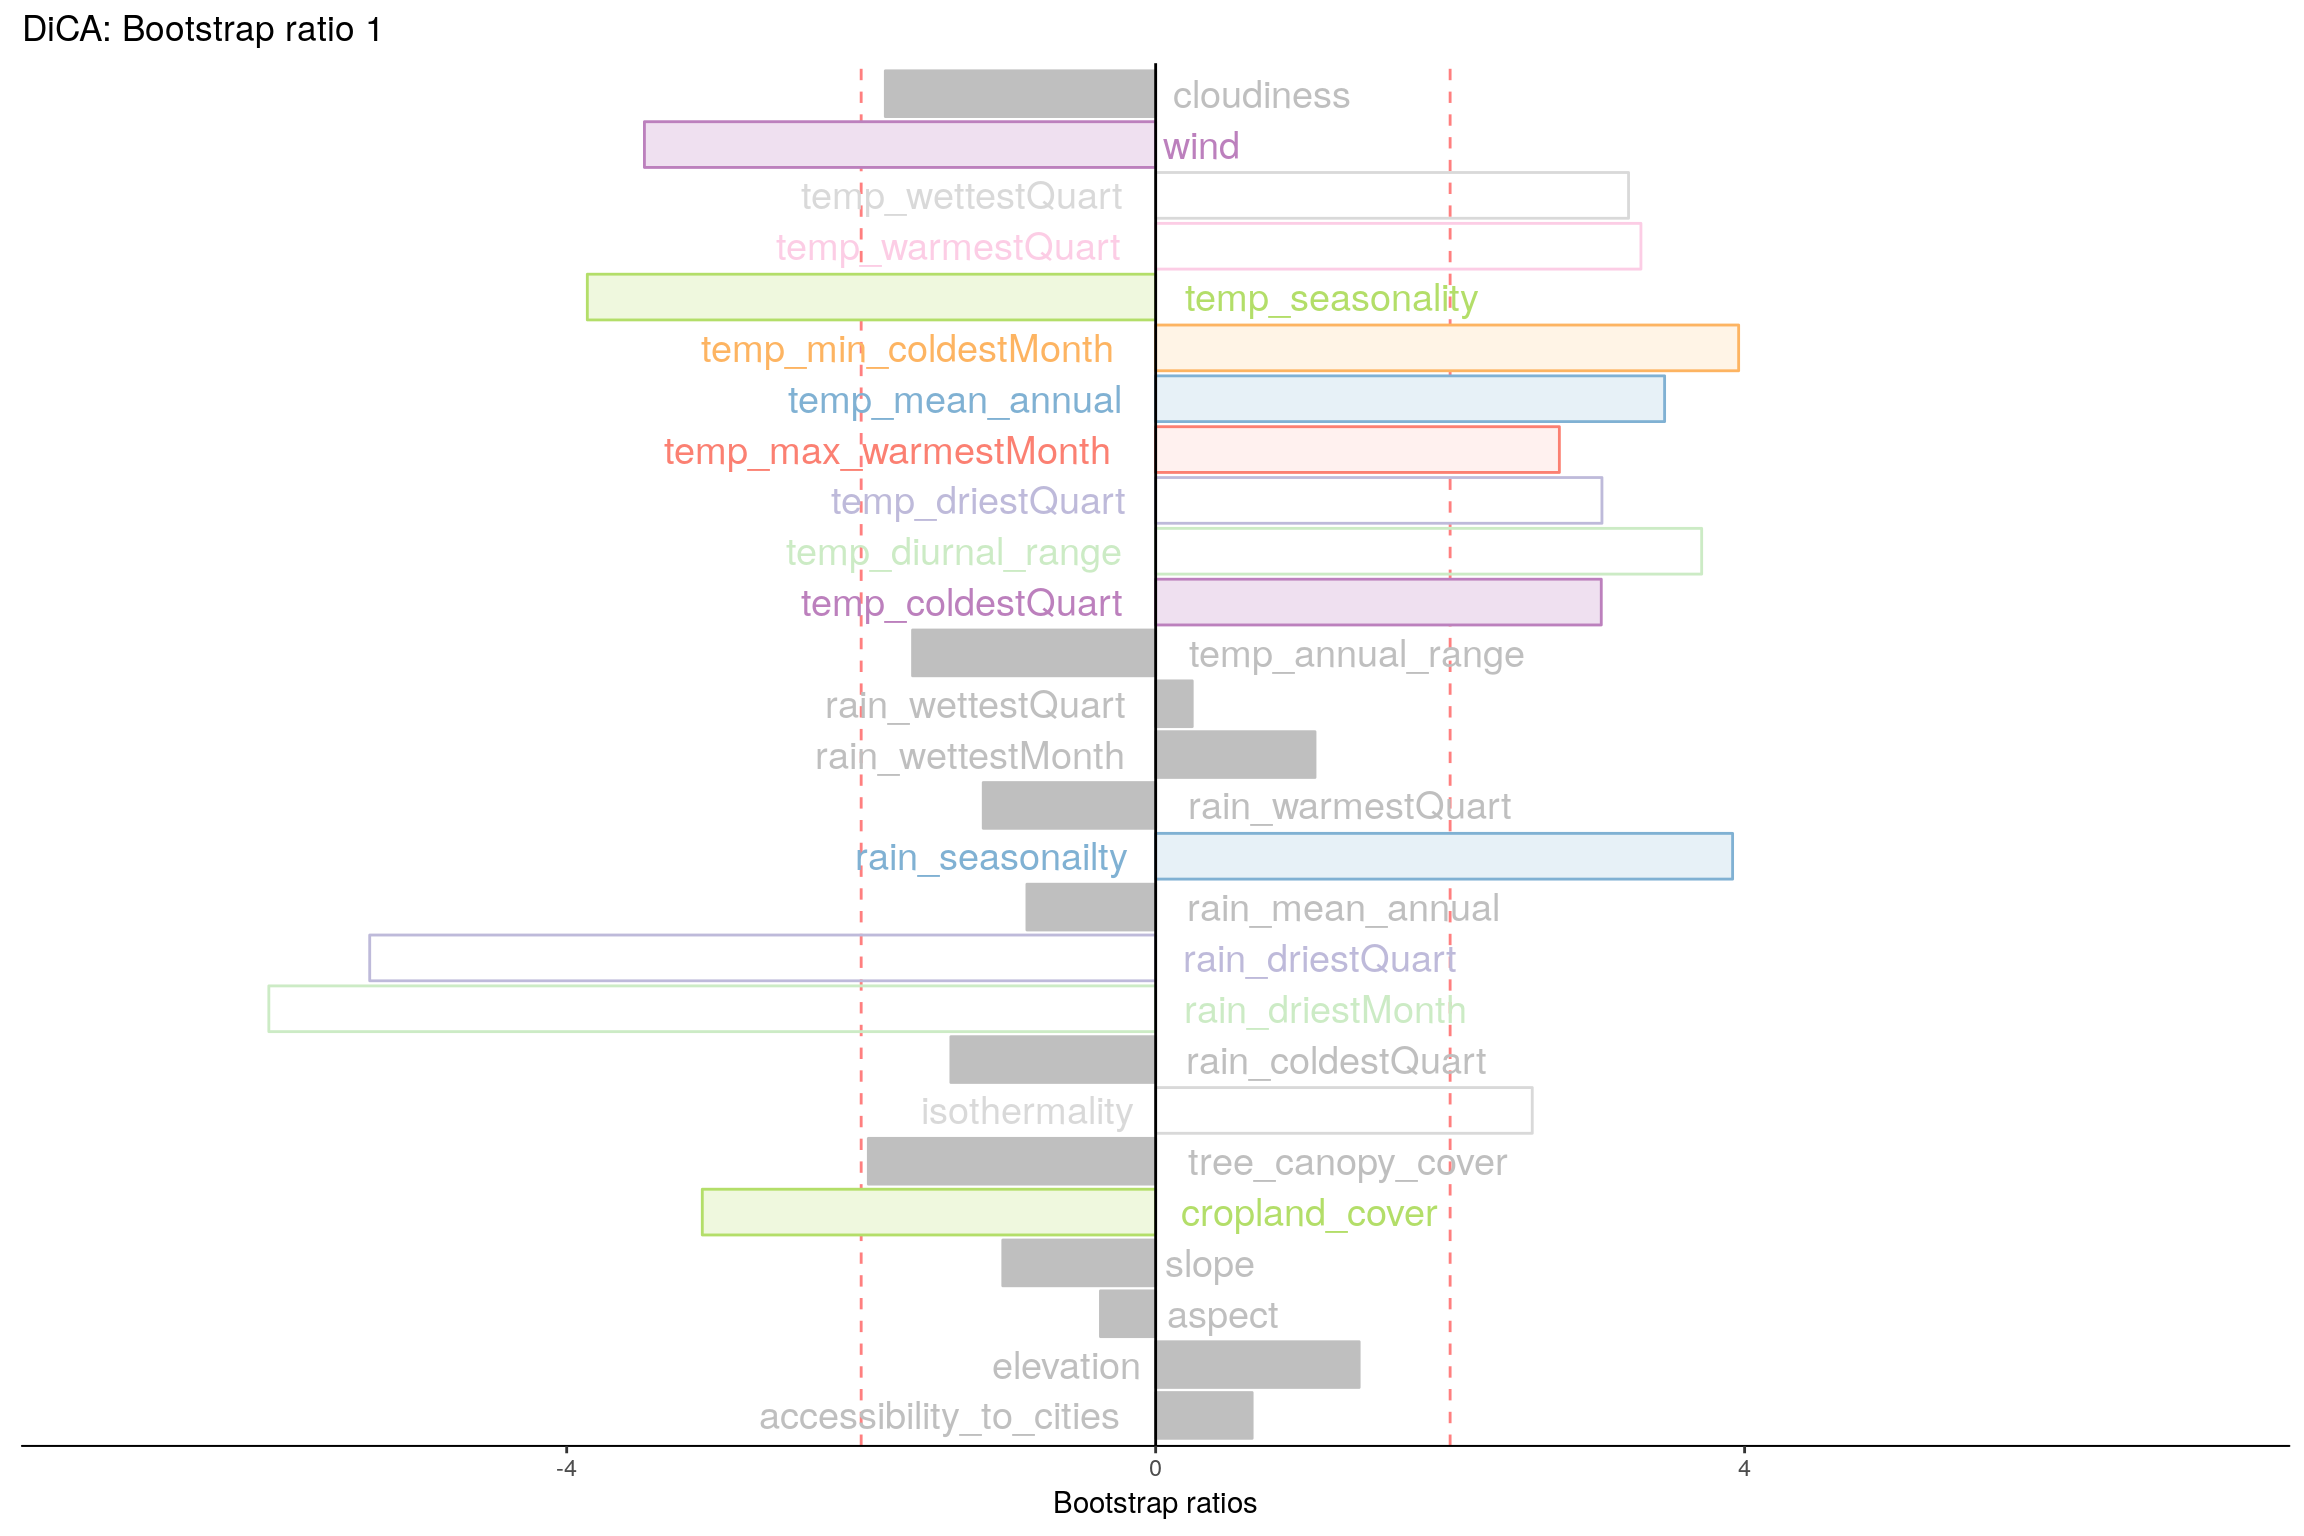
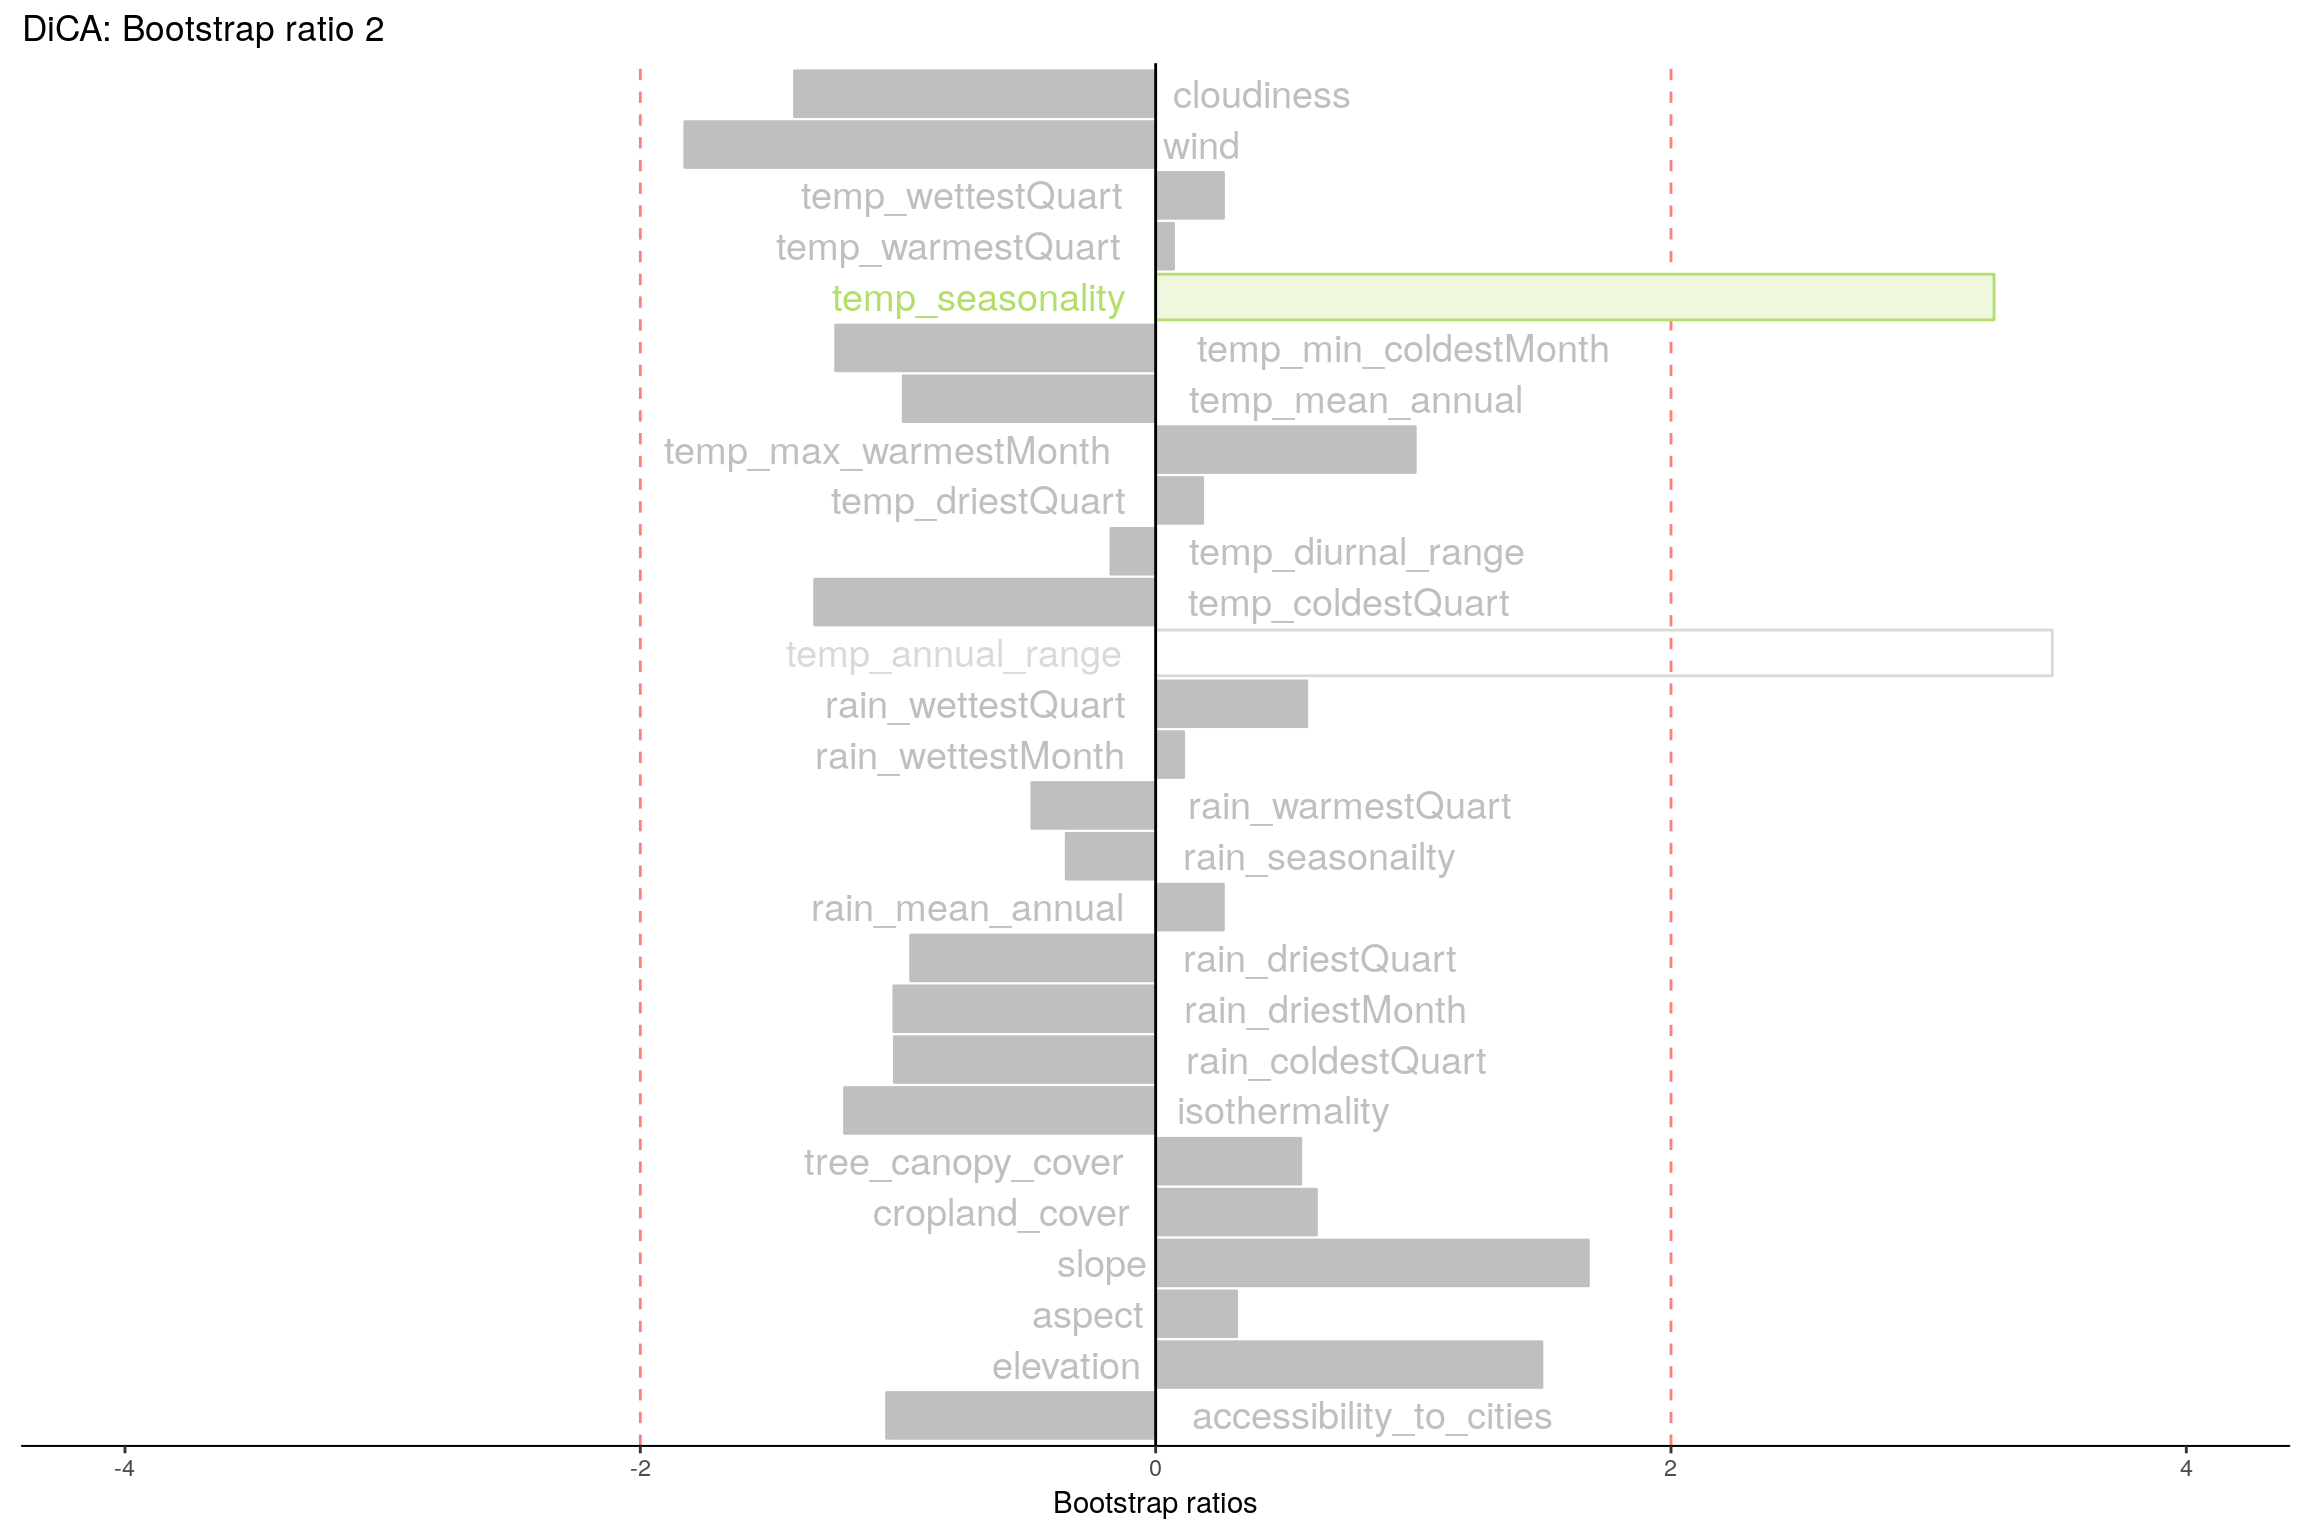
6.10 Most Contributing Variables (Inference)
Let’s plot variable contributions against each chosen components i.e. 1, 2.
- With Bootstrap Ratio
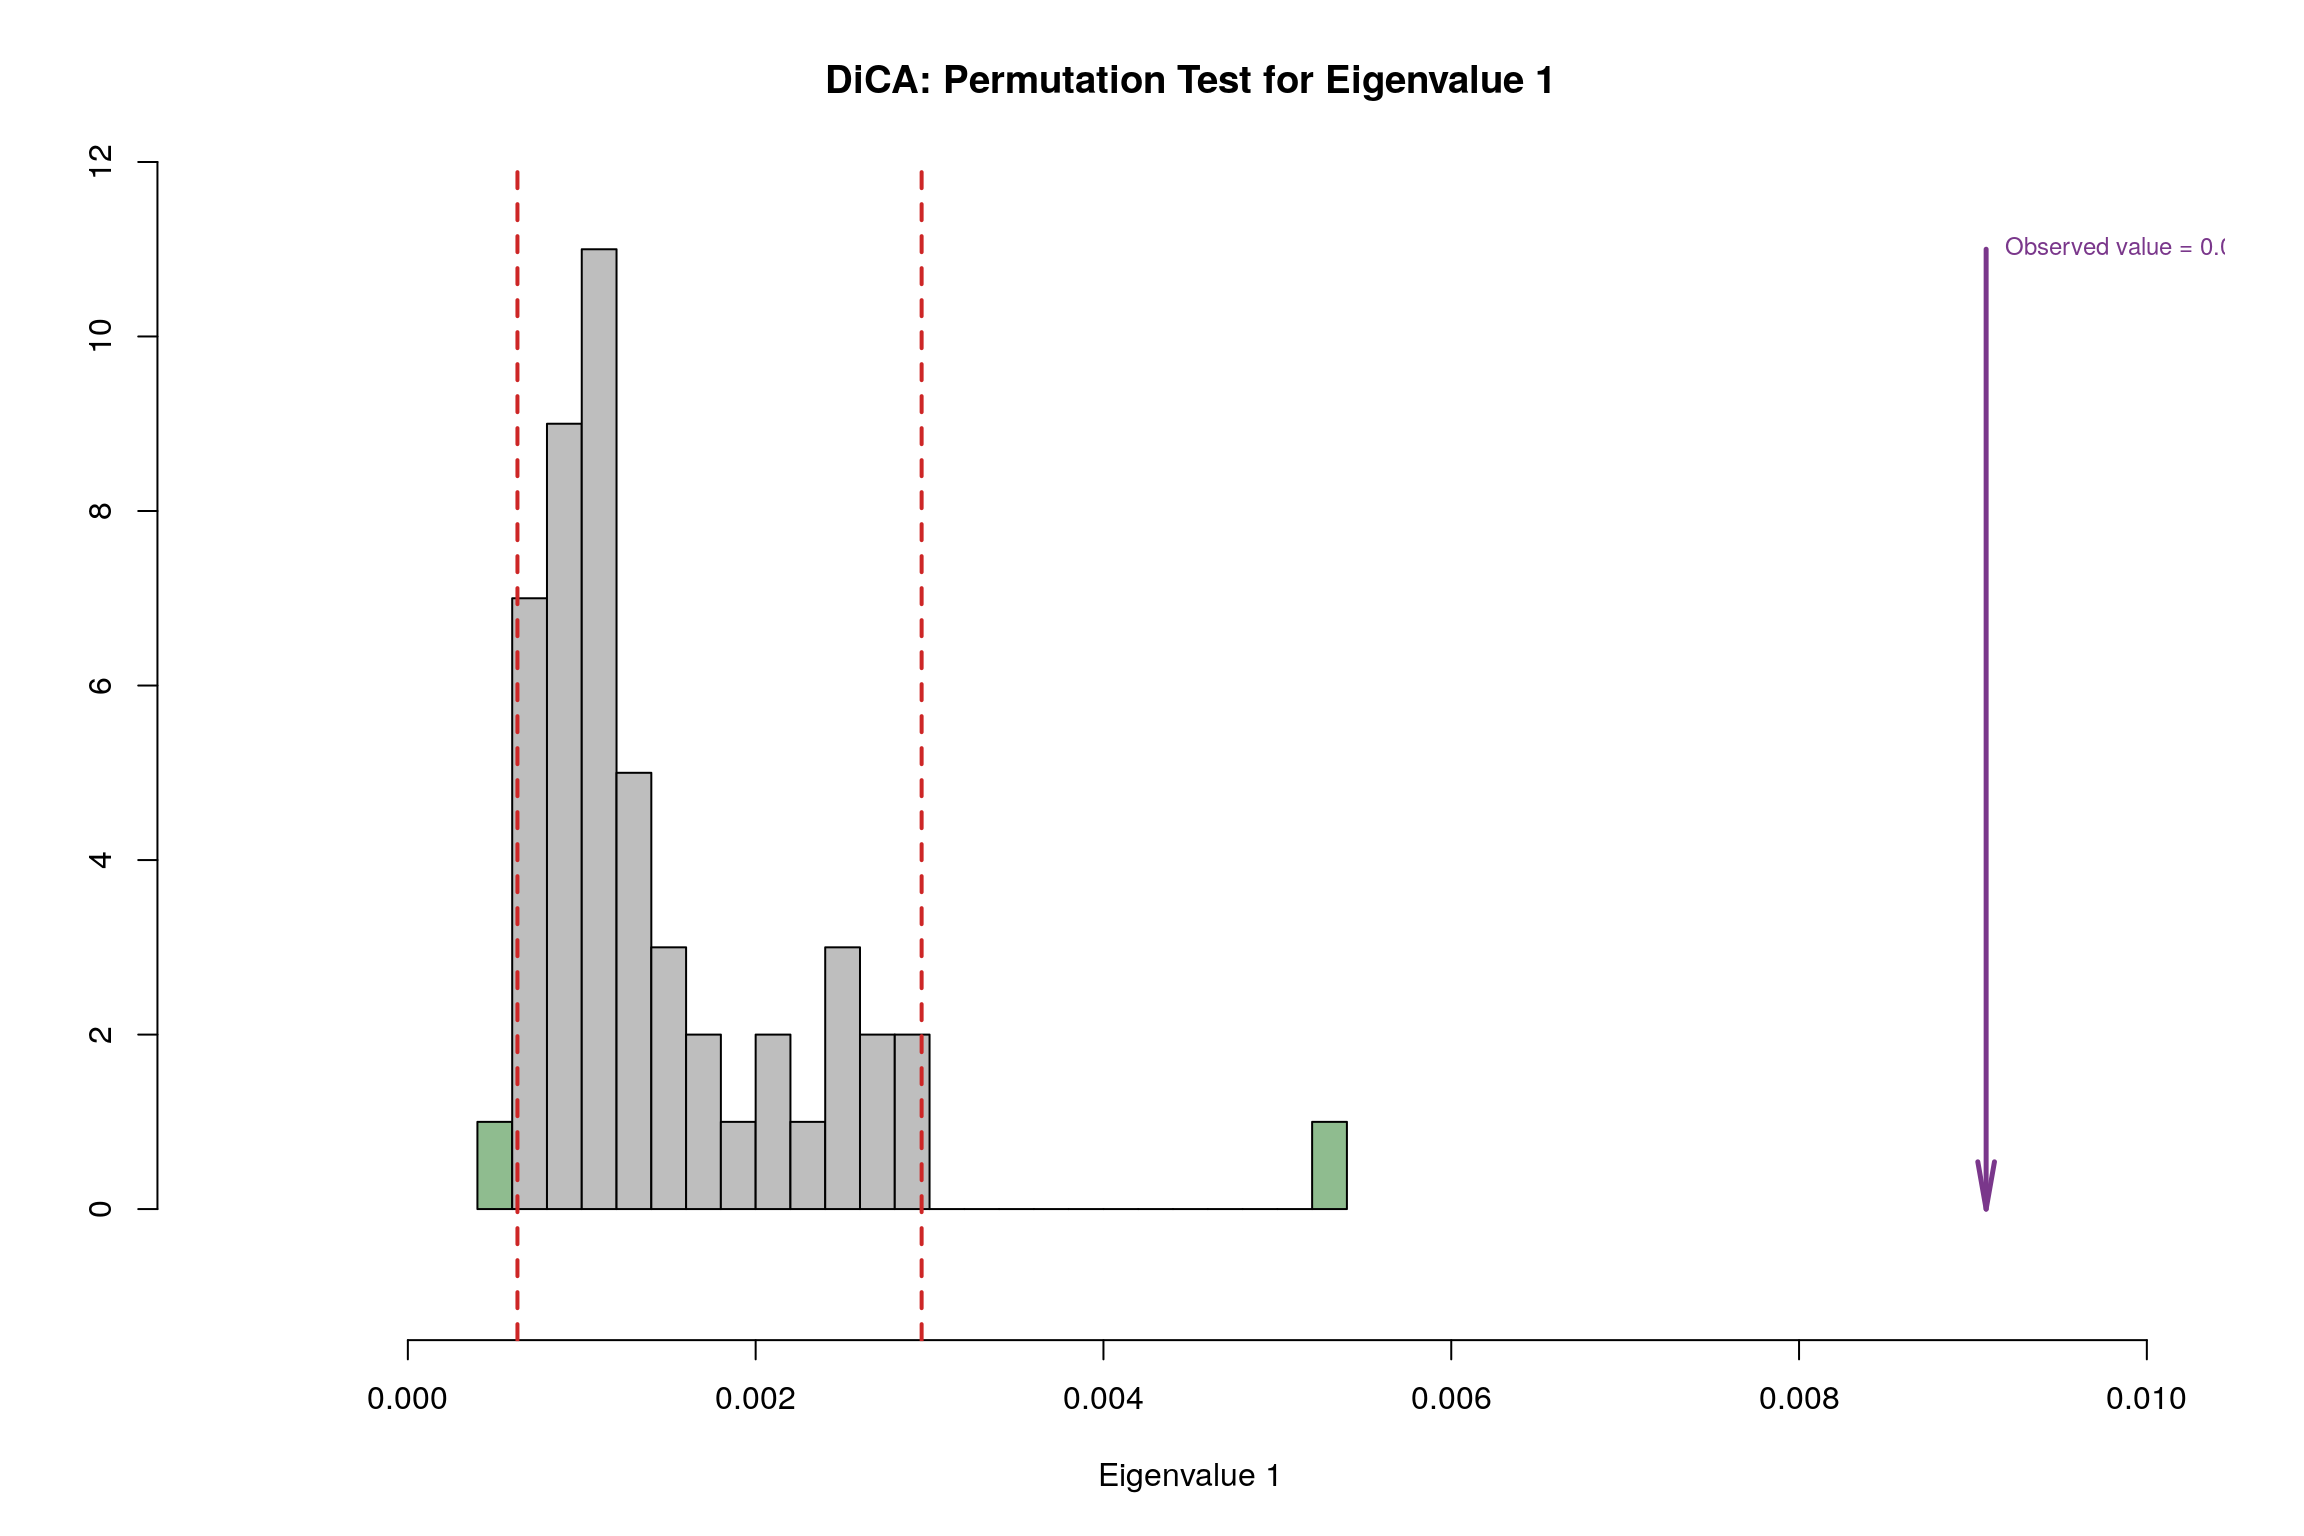
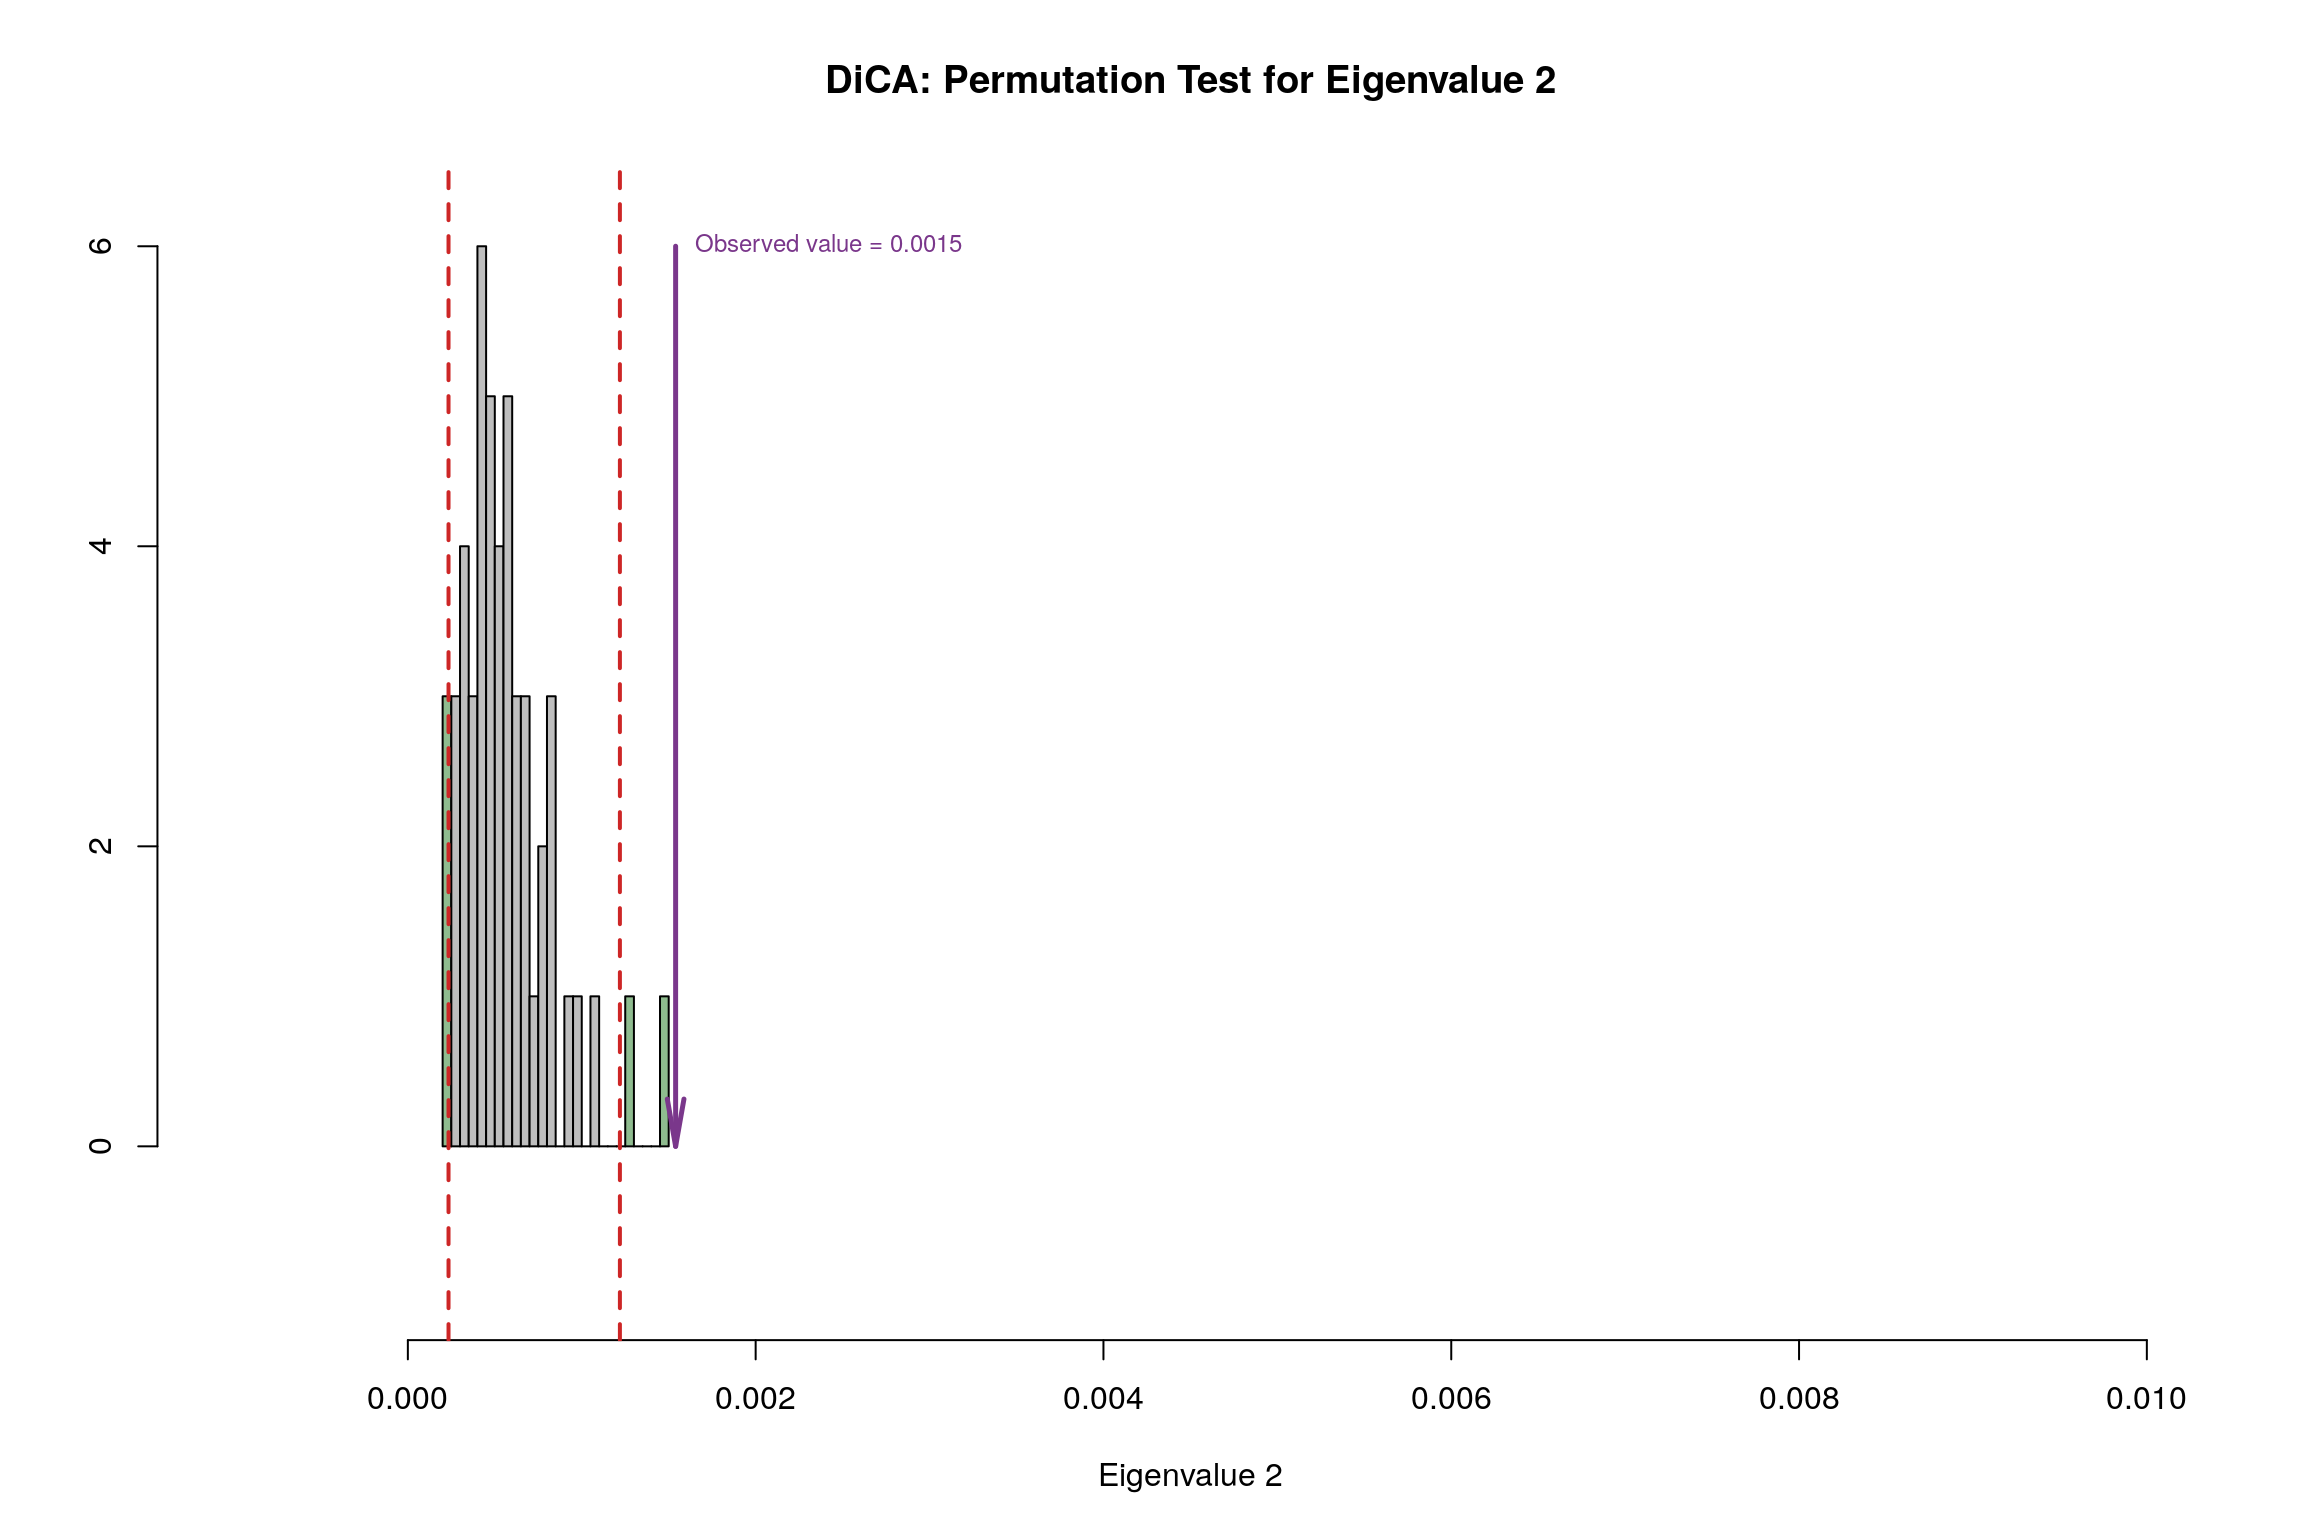
6.11 Permutation Test
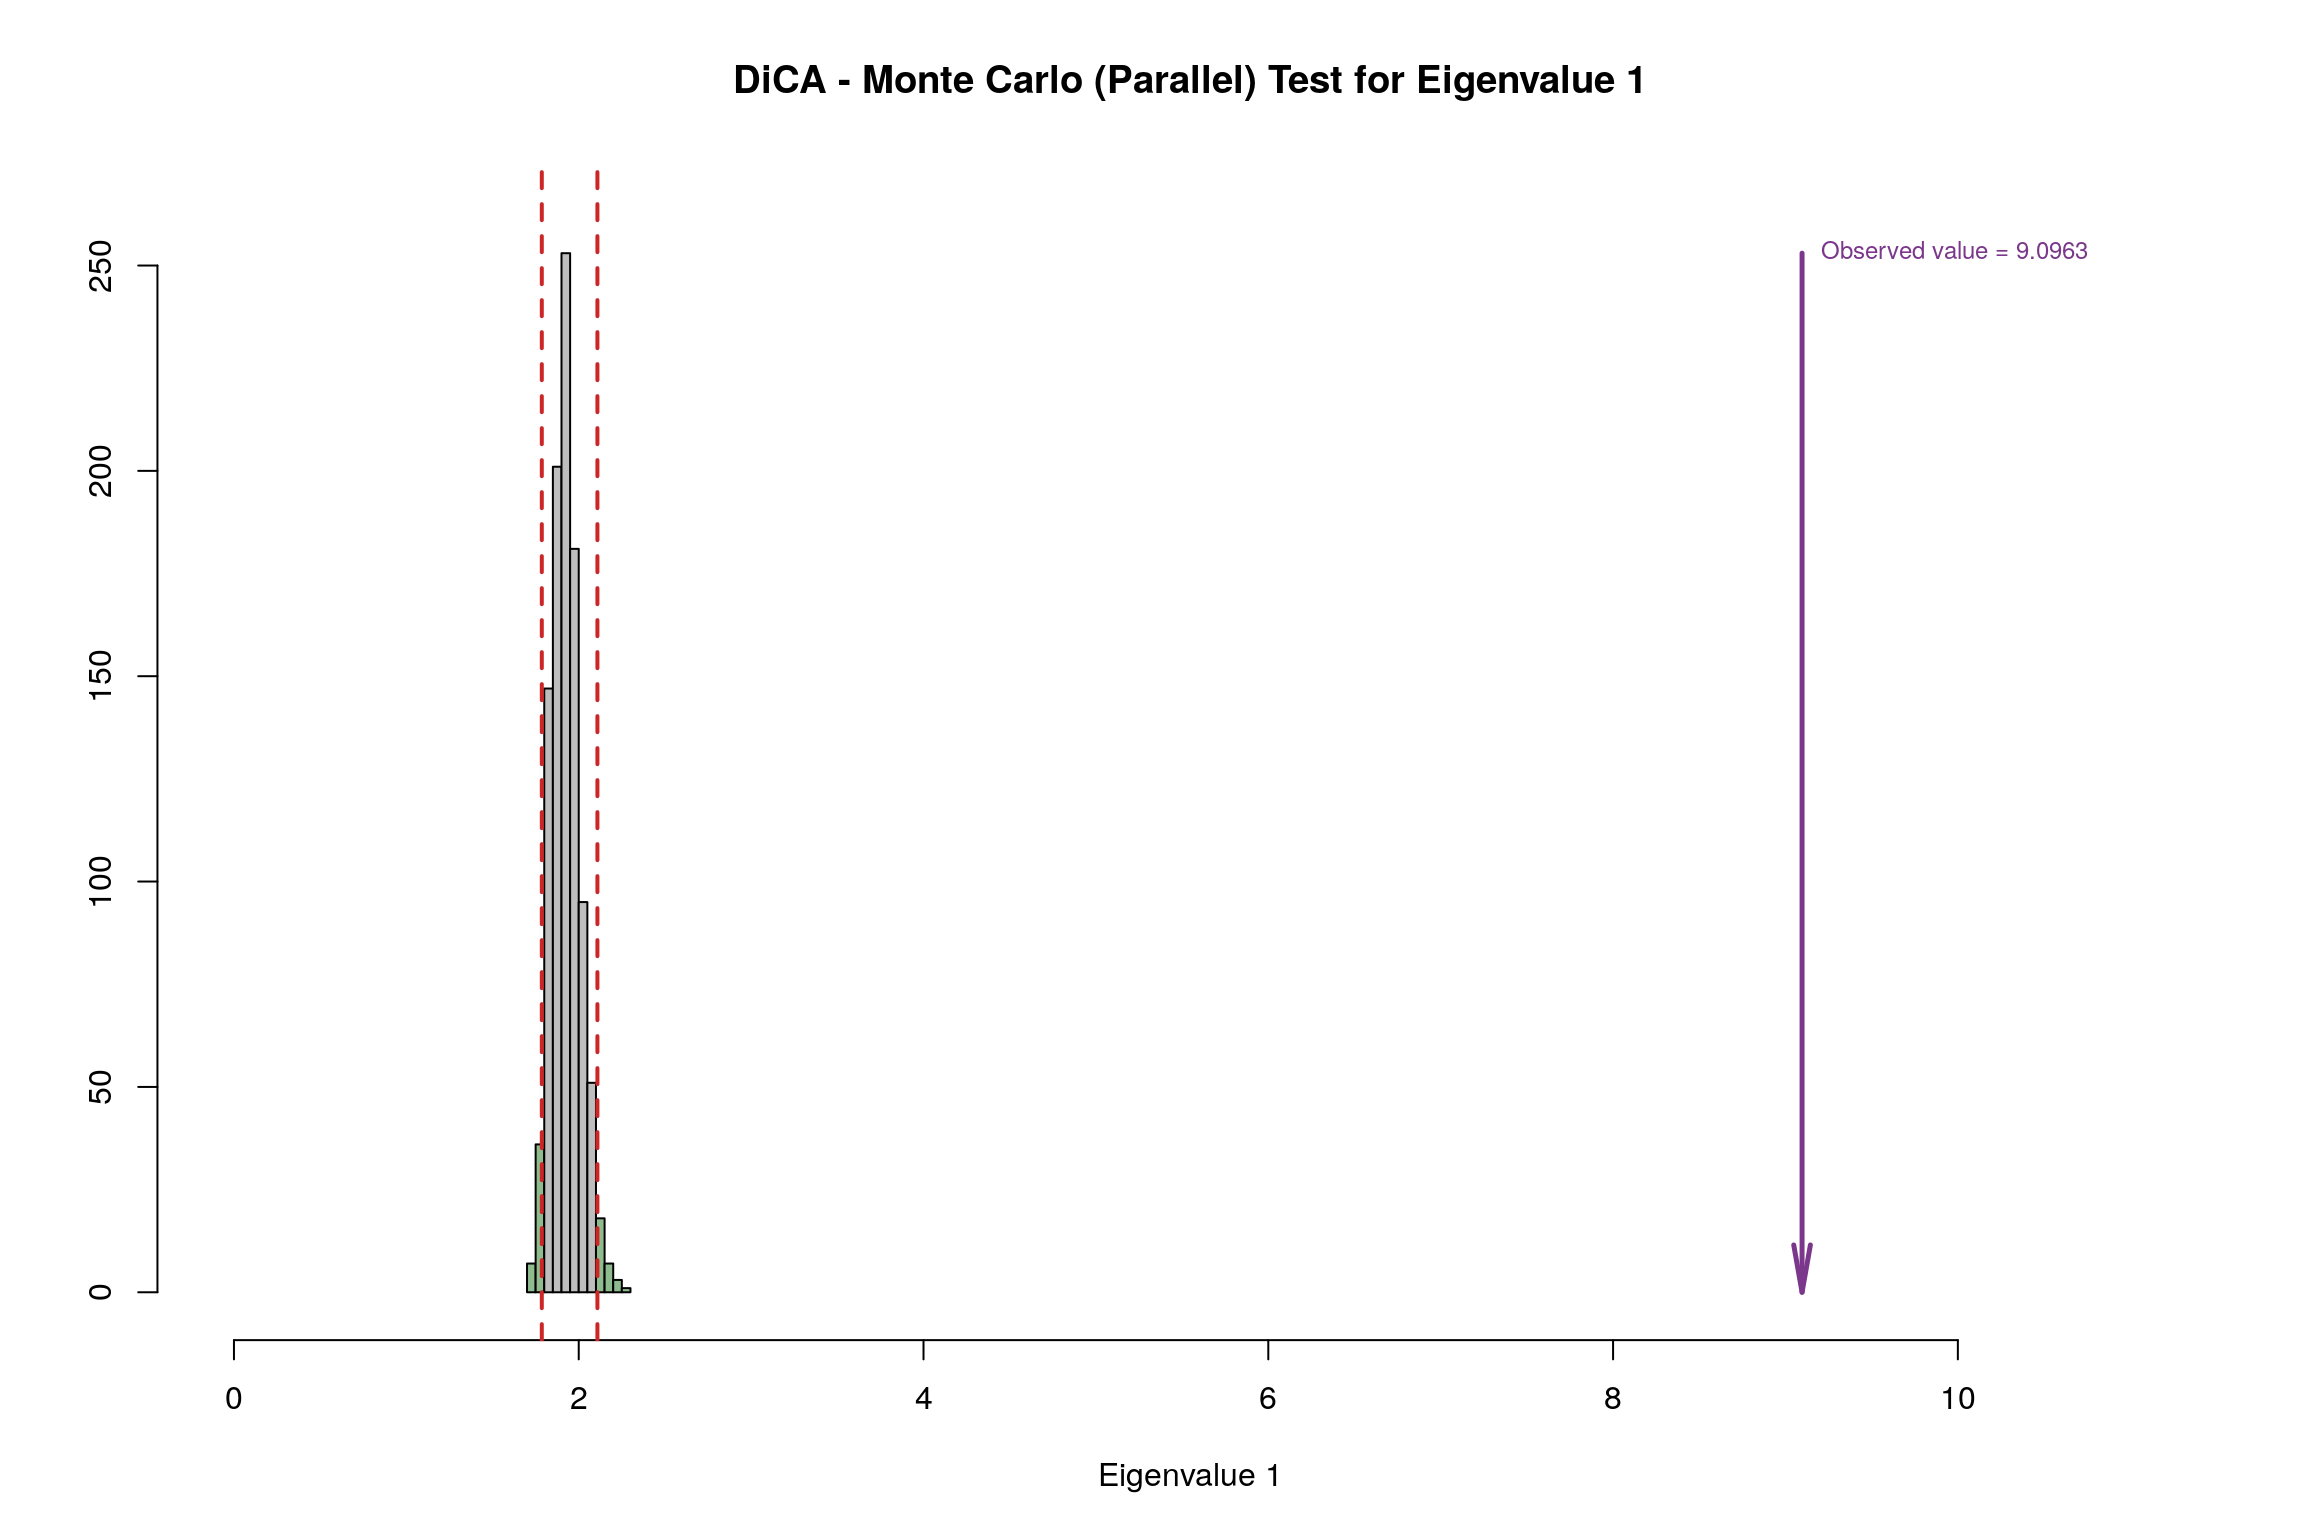
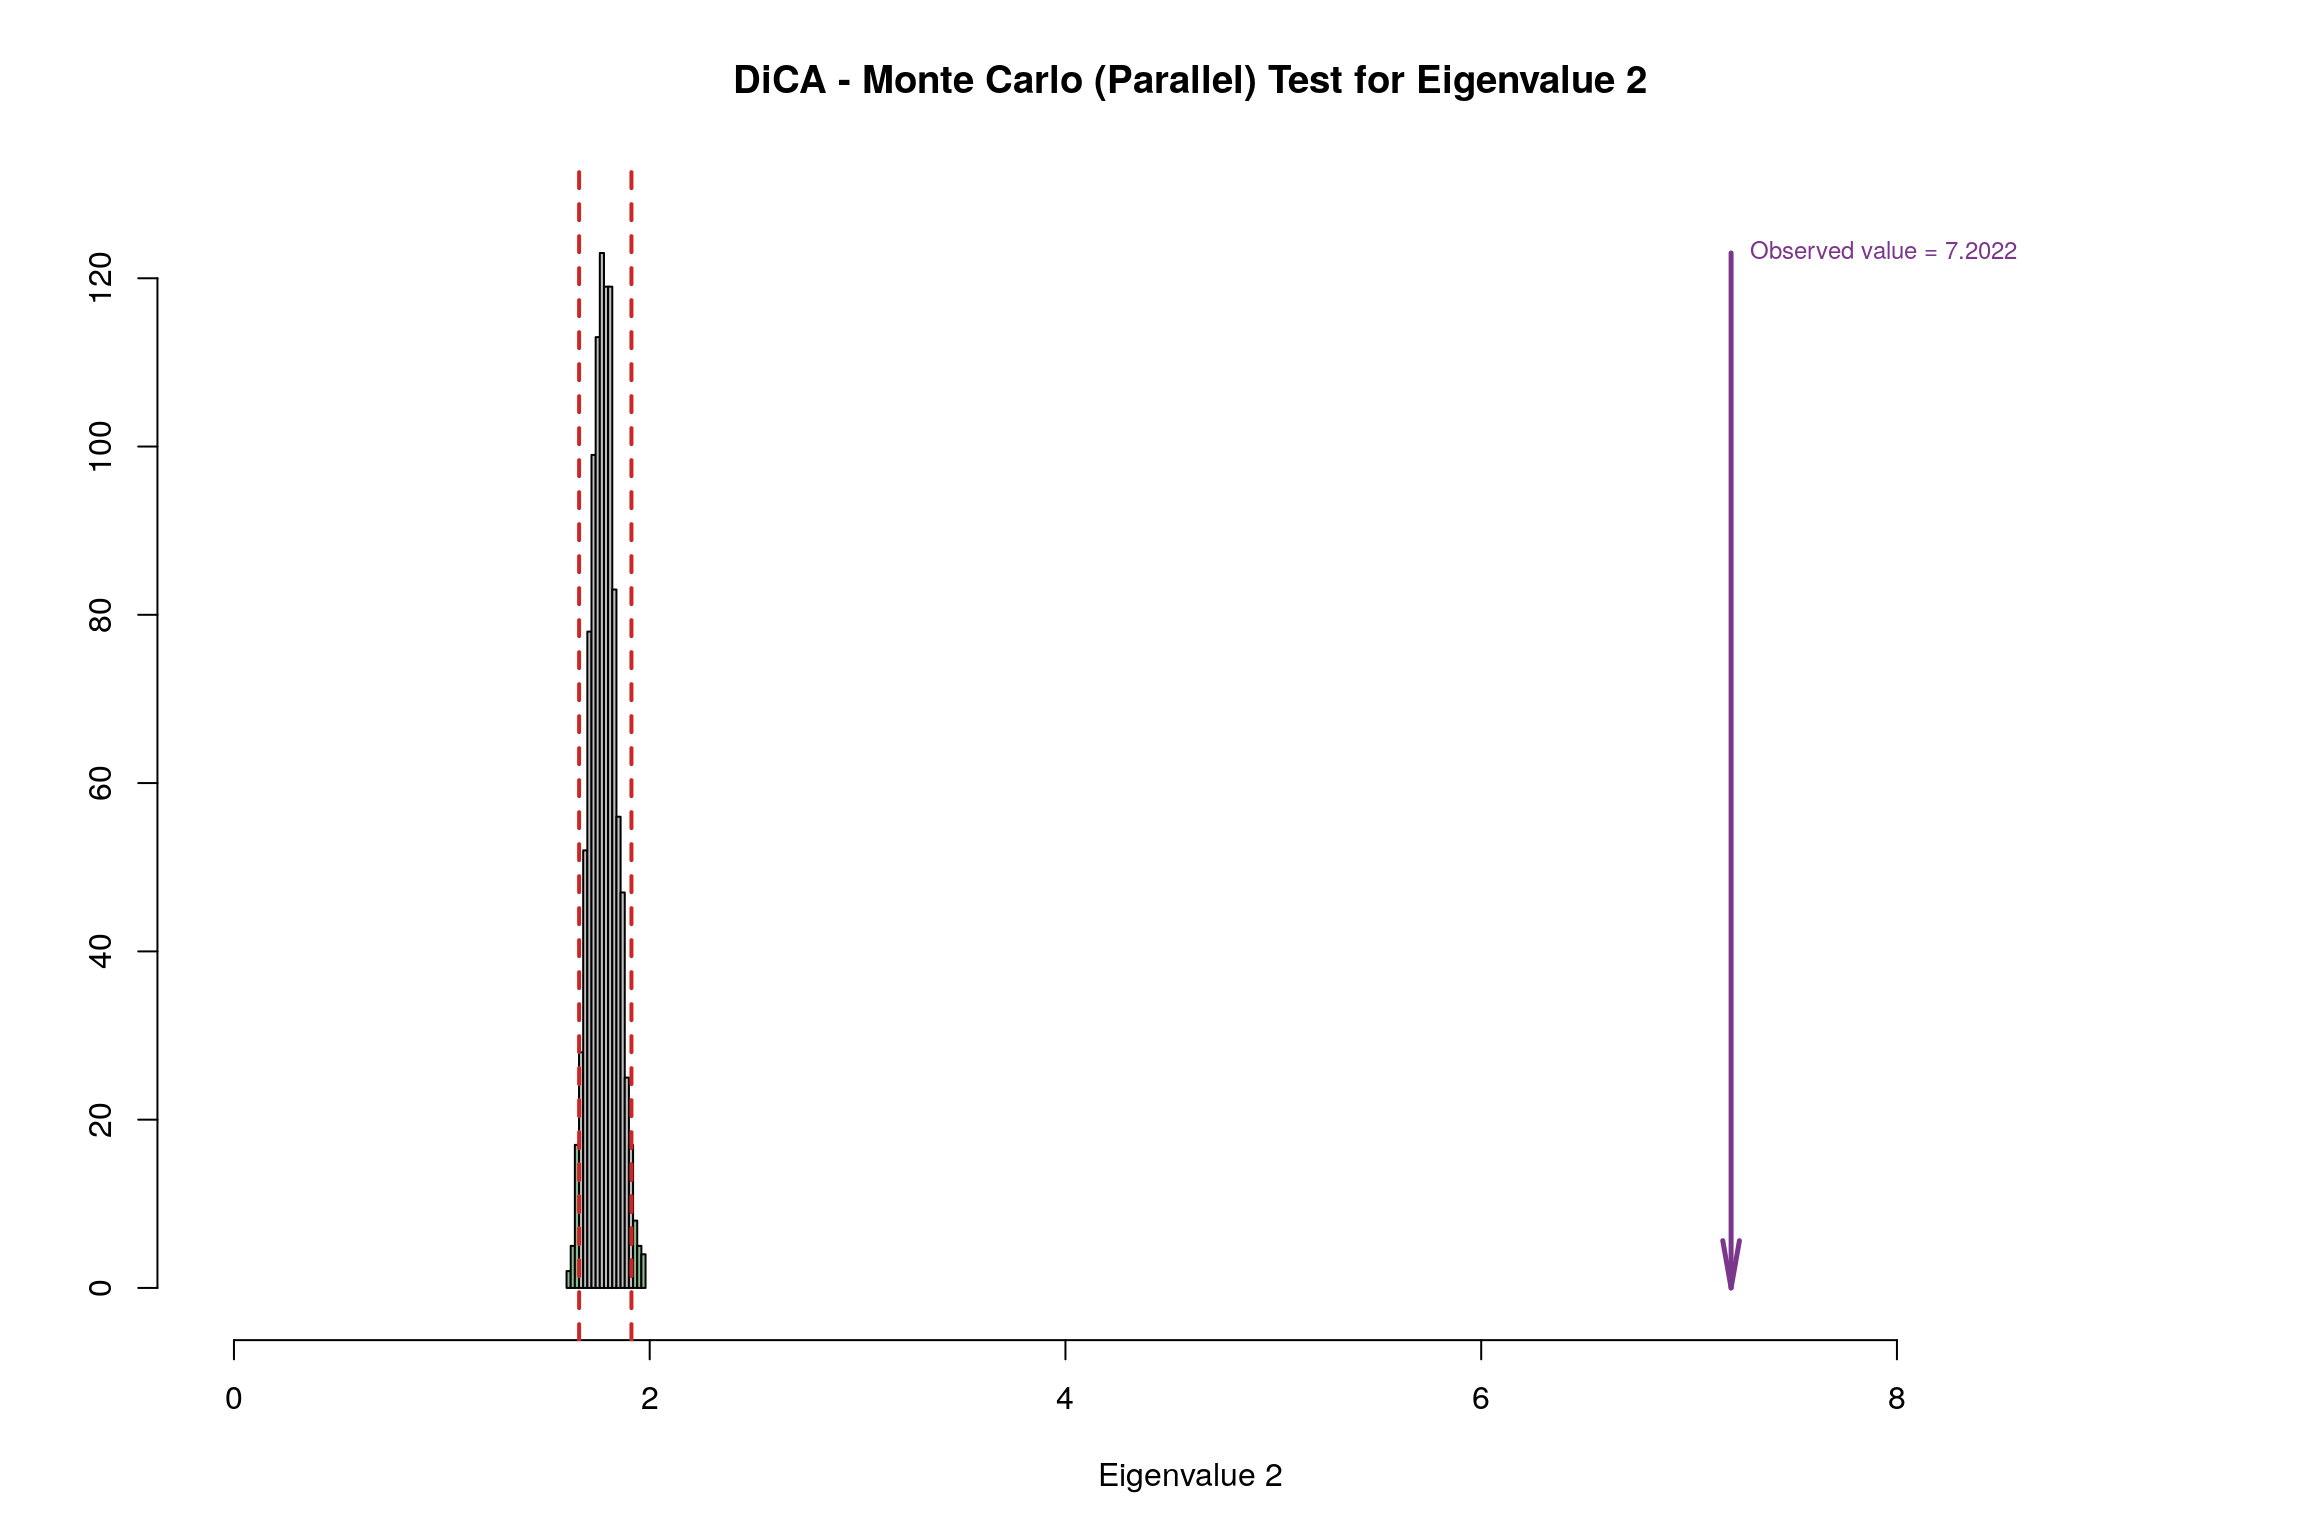
6.12 Parallet Test
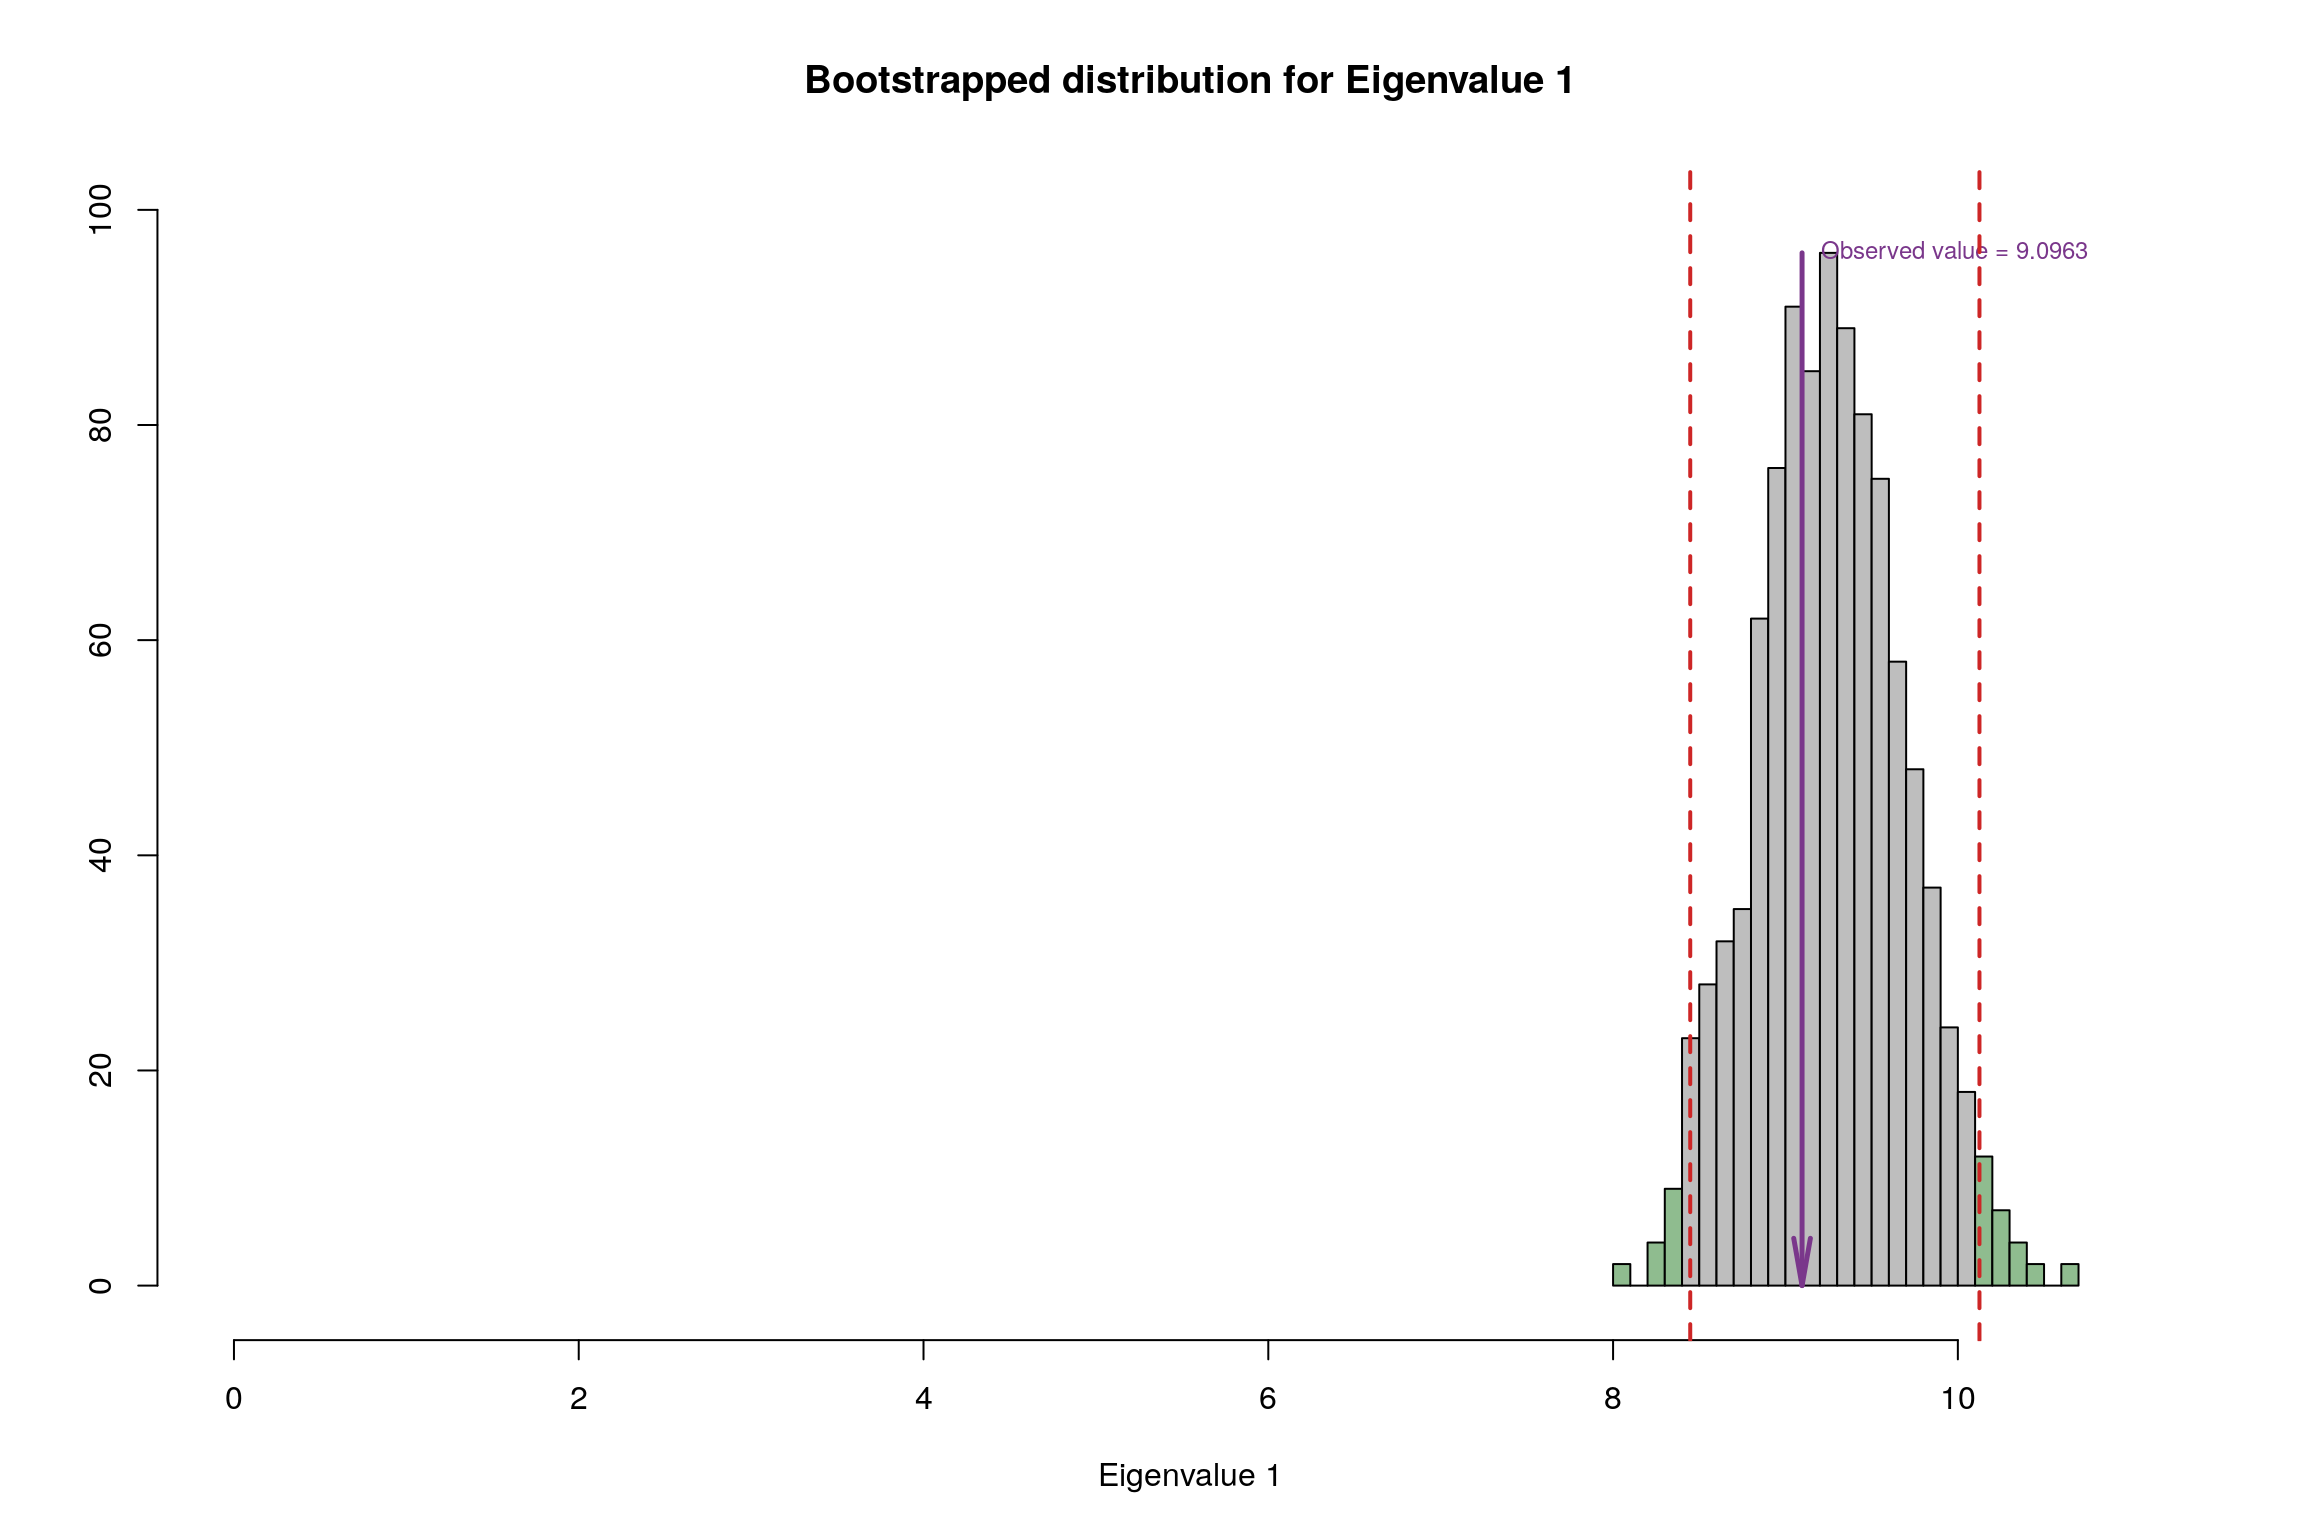
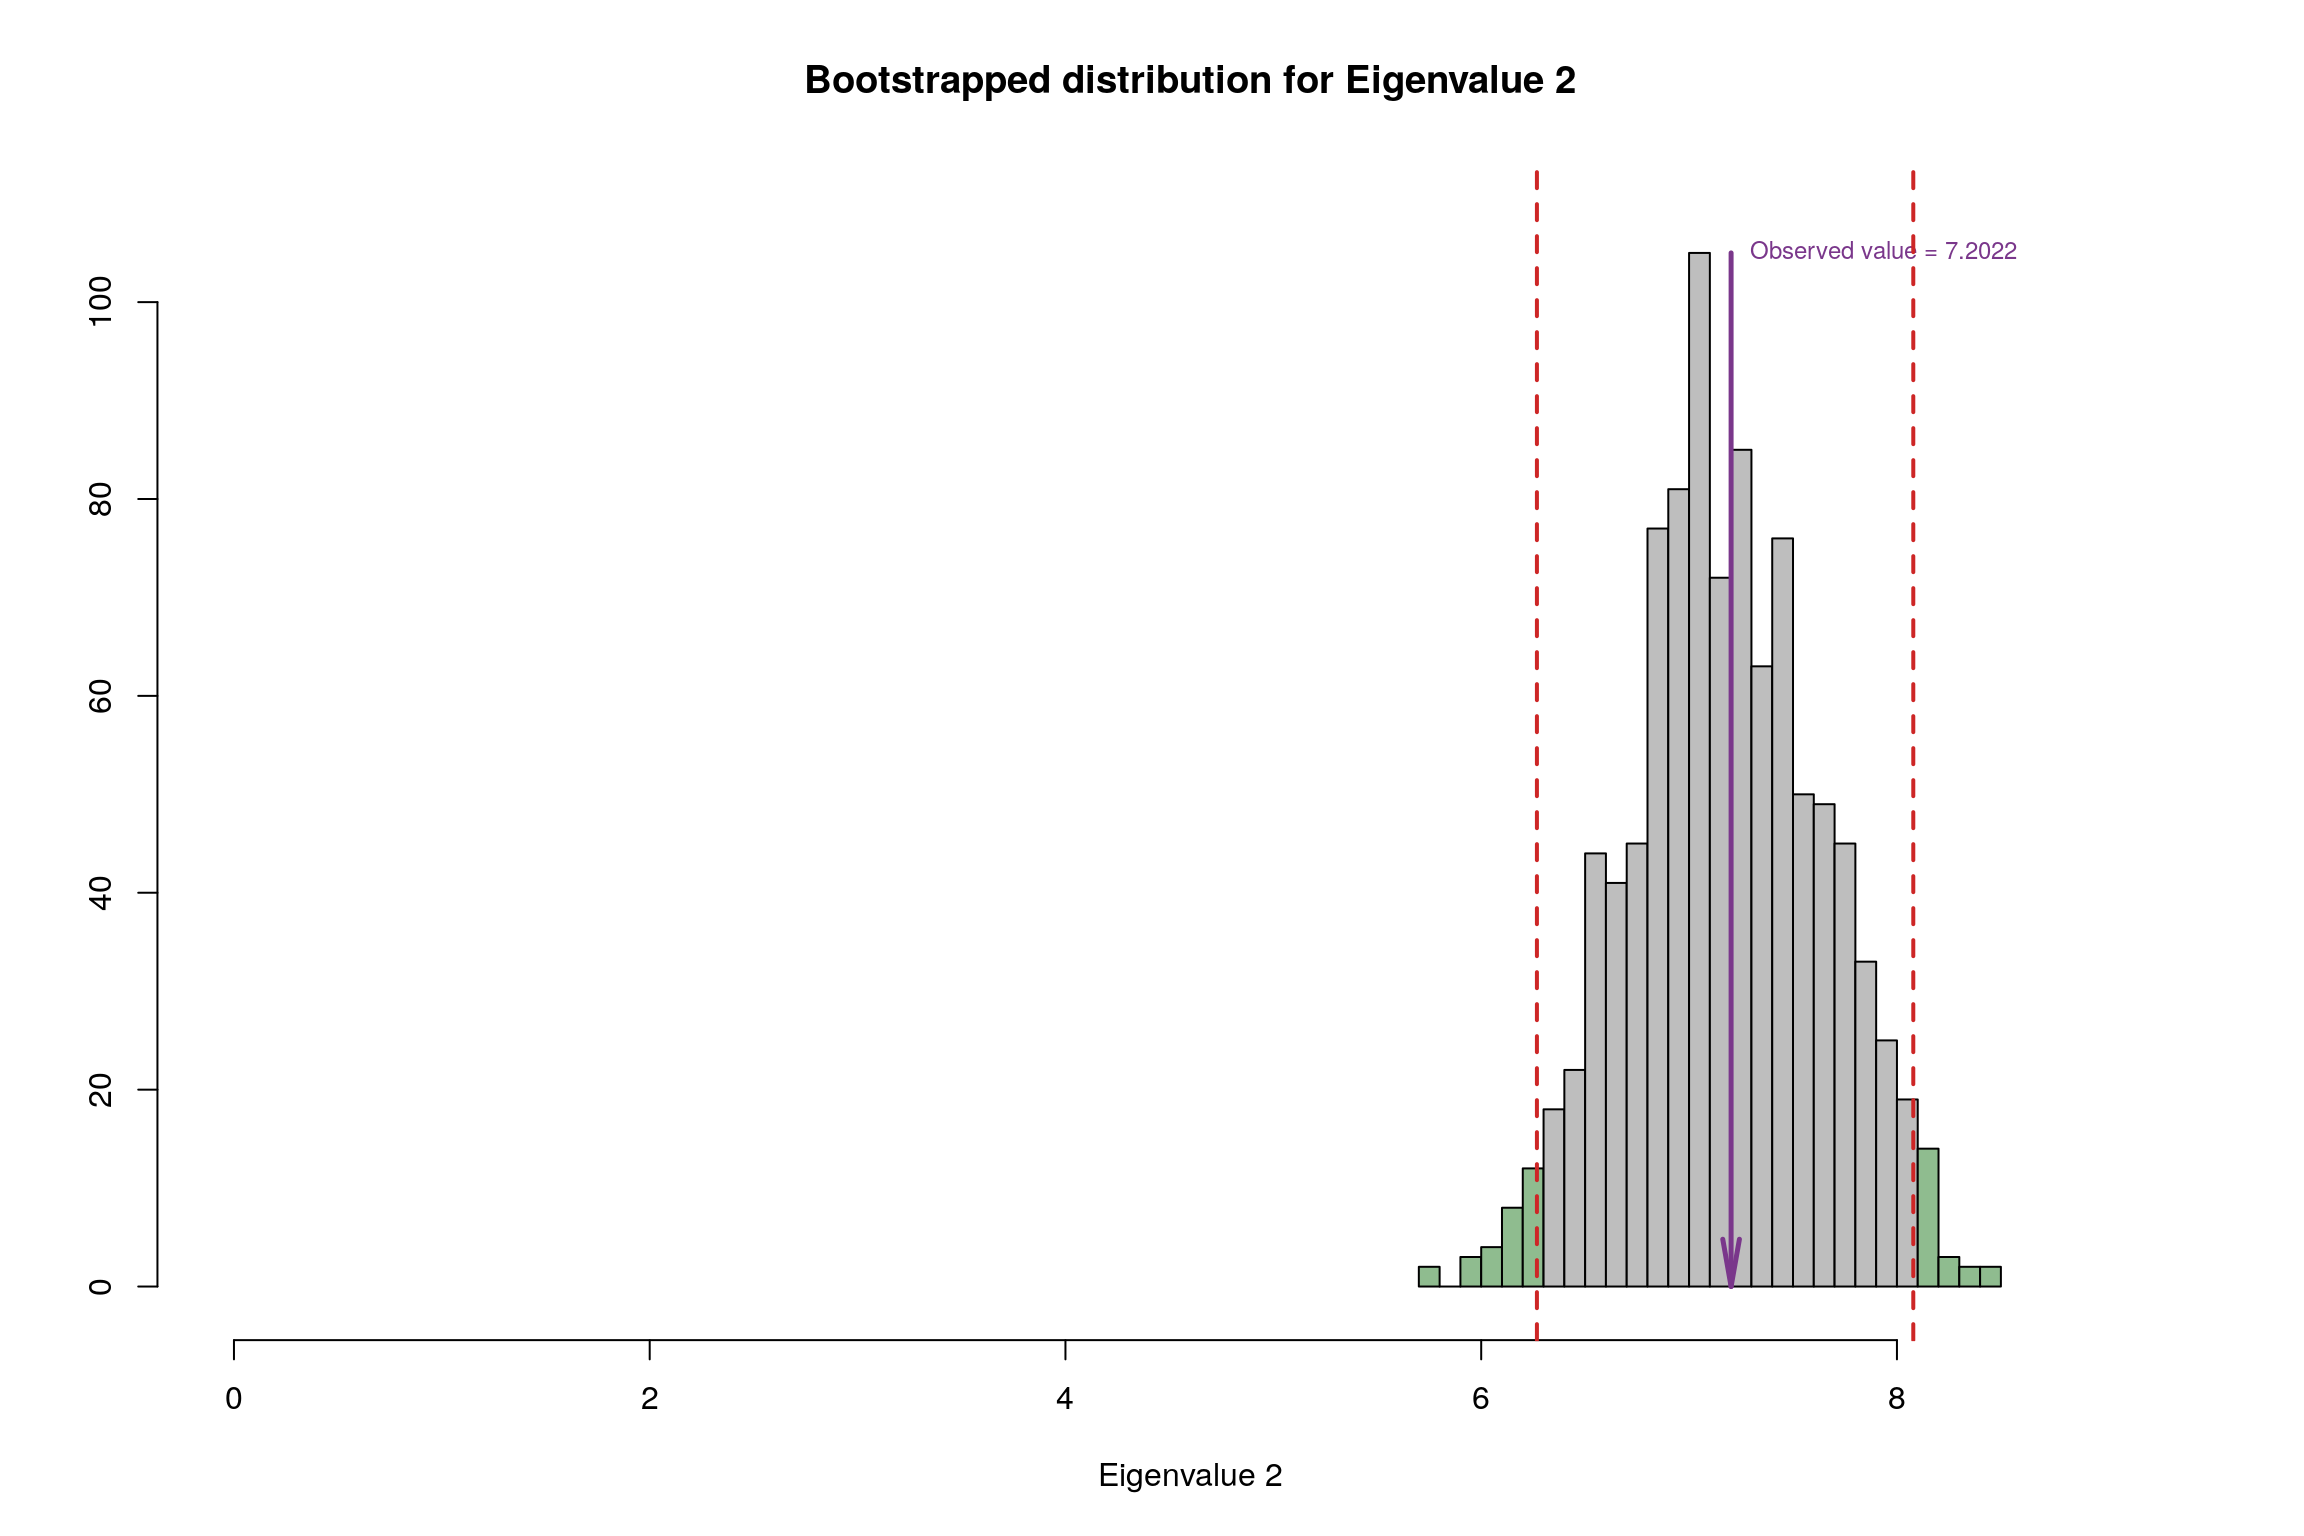
6.13 Bootstrap Test
6.14 Conclusion
| Methods | Unhappy | Normal | Very Happy | Reliability |
|---|---|---|---|---|
| DiCA | warm summers, cold winters, high rain | Higher variation in temperature is correlated with lower happiness | Warm winter, cold summer, low rain, windy | Convex hulls are separeted but second component only has temp variables as significant |